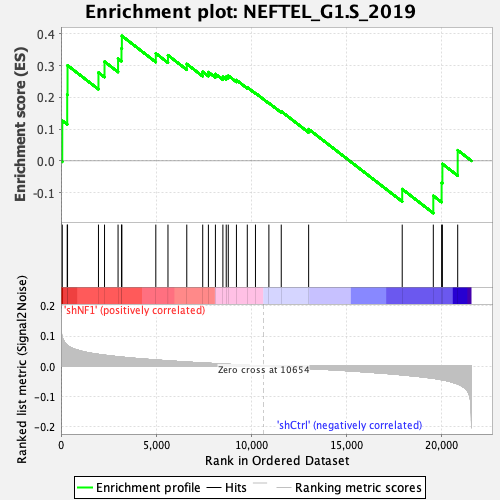
Profile of the Running ES Score & Positions of GeneSet Members on the Rank Ordered List
| Dataset | shNF1_exprs.shNF1_phenotype.cls #shNF1_versus_shCtrl.shNF1_phenotype.cls #shNF1_versus_shCtrl_repos |
| Phenotype | shNF1_phenotype.cls#shNF1_versus_shCtrl_repos |
| Upregulated in class | shNF1 |
| GeneSet | NEFTEL_G1.S_2019 |
| Enrichment Score (ES) | 0.39380807 |
| Normalized Enrichment Score (NES) | 1.3318803 |
| Nominal p-value | 0.09202454 |
| FDR q-value | 0.058548257 |
| FWER p-Value | 0.481 |
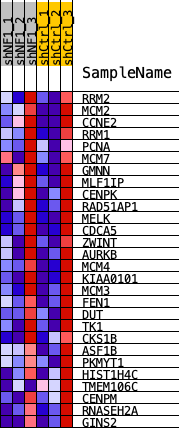
| SYMBOL | TITLE | RANK IN GENE LIST | RANK METRIC SCORE | RUNNING ES | CORE ENRICHMENT | |
|---|---|---|---|---|---|---|
| 1 | RRM2 | RRM2 | 67 | 0.095 | 0.1267 | Yes |
| 2 | MCM2 | MCM2 | 327 | 0.069 | 0.2088 | Yes |
| 3 | CCNE2 | CCNE2 | 344 | 0.068 | 0.3009 | Yes |
| 4 | RRM1 | RRM1 | 1971 | 0.039 | 0.2784 | Yes |
| 5 | PCNA | PCNA | 2290 | 0.036 | 0.3128 | Yes |
| 6 | MCM7 | MCM7 | 3002 | 0.031 | 0.3220 | Yes |
| 7 | GMNN | GMNN | 3182 | 0.030 | 0.3543 | Yes |
| 8 | MLF1IP | MLF1IP | 3203 | 0.030 | 0.3938 | Yes |
| 9 | CENPK | CENPK | 4988 | 0.020 | 0.3388 | No |
| 10 | RAD51AP1 | RAD51AP1 | 5628 | 0.017 | 0.3328 | No |
| 11 | MELK | MELK | 6617 | 0.013 | 0.3053 | No |
| 12 | CDCA5 | CDCA5 | 7456 | 0.010 | 0.2806 | No |
| 13 | ZWINT | ZWINT | 7755 | 0.009 | 0.2796 | No |
| 14 | AURKB | AURKB | 8124 | 0.008 | 0.2737 | No |
| 15 | MCM4 | MCM4 | 8517 | 0.007 | 0.2648 | No |
| 16 | KIAA0101 | KIAA0101 | 8693 | 0.006 | 0.2653 | No |
| 17 | MCM3 | MCM3 | 8801 | 0.006 | 0.2684 | No |
| 18 | FEN1 | FEN1 | 9230 | 0.004 | 0.2546 | No |
| 19 | DUT | DUT | 9801 | 0.003 | 0.2318 | No |
| 20 | TK1 | TK1 | 10231 | 0.001 | 0.2136 | No |
| 21 | CKS1B | CKS1B | 10937 | -0.001 | 0.1822 | No |
| 22 | ASF1B | ASF1B | 11588 | -0.003 | 0.1561 | No |
| 23 | PKMYT1 | PKMYT1 | 13029 | -0.008 | 0.0999 | No |
| 24 | HIST1H4C | HIST1H4C | 17952 | -0.029 | -0.0889 | No |
| 25 | TMEM106C | TMEM106C | 19588 | -0.040 | -0.1100 | No |
| 26 | CENPM | CENPM | 20025 | -0.045 | -0.0692 | No |
| 27 | RNASEH2A | RNASEH2A | 20066 | -0.045 | -0.0094 | No |
| 28 | GINS2 | GINS2 | 20871 | -0.059 | 0.0336 | No |