NF1 regulates mesenchymal glioblastoma plasticity and aggressiveness through the AP-1 transcription factor FOSL1
- CarolinaMarques1
- ThomasUnterkircher2
- PaulaKroon1
- BarbaraOldrini1
- AnnalisaIzzo2
- YuliiaDramaretska3
- RobertoFerrarese2
- EvaKling2
- OliverSchnell2
- SvenNelander45
- ErwinFWagner678
- LatifaBakiri67
- GaetanoGargiulo3
- MariaStellaCarro[email protected]2
- MassimoSquatrito[email protected]1
- Research Article
- Cancer Biology
- GBM
- mesenchymal
- NF1
- FOSL1
- FRA-1
- Human
- Mouse
- publisher-id64846
- doi10.7554/eLife.64846
- elocation-ide64846
Abstract
The molecular basis underlying glioblastoma (GBM) heterogeneity and plasticity is not fully understood. Using transcriptomic data of human patient-derived brain tumor stem cell lines (BTSCs), classified based on GBM-intrinsic signatures, we identify the AP-1 transcription factor as a key regulator of the mesenchymal (MES) subtype. We provide a mechanistic basis to the role of the neurofibromatosis type 1 gene (NF1), a negative regulator of the RAS/MAPK pathway, in GBM mesenchymal transformation through the modulation of expression. Depletion of in -mutant human BTSCs and -mutant mouse neural stem cells results in loss of the mesenchymal gene signature and reduction in stem cell properties and in vivo tumorigenic potential. Our data demonstrate that controls GBM plasticity and aggressiveness in response to alterations.
Introduction
Gliomas are the most common primary brain tumor in adults. Given the strong association of the isocitrate dehydrogenase 1 and 2 (IDH1/2) genes mutations with glioma patients survival, the 2016 WHO classification, which integrates both histological and molecular features, has introduced the distinction of IDH-wildtype (IDH-wt) or IDH-mutant (IDH-mut) in diffuse gliomas 51Louis et al.2016. IDH-wt glioblastoma (GBM) represents the most frequent and aggressive form of gliomas, characterized by high molecular and cellular inter- and intra-tumoral heterogeneity.
Large-scale sequencing approaches have evidenced how concurrent perturbations of cell cycle regulators, growth and survival pathways, mediated by RAS/MAPK and PI3K/AKT signaling, play a significant role in driving adult GBMs 12Brennan et al.201314Cancer Genome Atlas Research Network200885Verhaak et al.2010. Moreover, various studies have classified GBM in different subtypes, using transcriptional profiling, being now the proneural (PN), classical (CL), and mesenchymal (MES) the most widely accepted 64Phillips et al.200685Verhaak et al.201087Wang et al.2017. Patients with the MES subtype tend to have worse survival rates compared to other subtypes, both in the primary and recurrent tumor settings 87Wang et al.2017. The most frequent genetic alterations – neurofibromatosis type 1 gene (NF1) copy number loss or mutation – and important regulators of the MES subtype, such as STAT3, CEBPB, and TAZ, have been identified 9Bhat et al.201115Carro et al.201085Verhaak et al.2010. Nevertheless, the mechanisms of regulation of MES GBMs are still not fully understood. For example, whether the MES transcriptional signature is controlled through tumor cell-intrinsic mechanisms or influenced by the tumor microenvironment (TME) is still an unsolved question. In fact, the critical contribution of the TME adds another layer of complexity to MES GBMs. Tumors from this subtype are highly infiltrated by non-neoplastic cells as compared to PN and CL subtypes 87Wang et al.2017. Additionally, MES tumors express high levels of angiogenic markers and exhibit high levels of necrosis 21Cooper et al.2012.
Even though each subtype is associated with specific genetic alterations, there is a considerable plasticity among them: different subtypes coexist in the same tumors and shifts in subtypes can occur over time 63Patel et al.201473Sottoriva et al.2013. This plasticity may be explained by acquisition of new genetic and epigenetic abnormalities, stem-like reprogramming, or clonal variation 29Fedele et al.2019. It is also not fully understood whether the distinct subtypes evolve from a common glioma precursor 62Ozawa et al.2014. For instance, PN and CL tumors often switch phenotype to MES upon recurrence, and treatment also increases the mesenchymal gene signature, suggesting that MES transition, or epithelial to mesenchymal (EMT)-like, in GBM is associated with tumor progression and therapy resistance 10Bhat et al.201339Halliday et al.201464Phillips et al.2006. Yet, the frequency and relevance of this EMT-like phenomenon in glioma progression remains unclear. EMT has also been associated with stemness in other cancers 54Mani et al.200878Tam and Weinberg201392Ye et al.2015. Glioma stem cells (GSCs) share features with normal neural stem cells (NSCs) such as self-renewal and ability to differentiate into distinct cellular lineages (astrocytes, oligodendrocytes, and neurons) but are thought to be responsible for tumor relapse, given their ability to repopulate tumors and their resistance to treatment 5Bao et al.200619Chen et al.2012. GSCs heterogeneity is also being increasingly observed 10Bhat et al.201353Mack et al.201967Richards et al.2021, but whether genotype-to-phenotype connections exist remain to be clarified.
FOSL1, which encodes FRA-1, is an AP-1 transcription factor (TF) with prognostic value in different epithelial tumors, where its overexpression correlates with tumor progression or worse patient survival 20Chiappetta et al.200733Gao et al.201781Usui et al.201282Vallejo et al.201789Wu et al.201591Xu et al.2017. Moreover, the role of FOSL1 in EMT has been documented in breast and colorectal cancers 2Andreolas et al.20084Bakiri et al.201524Diesch et al.2014. In GBM, it has been shown that FOSL1 modulates in vitro glioma cell malignancy 23Debinski and Gibo2005.
Here we report that NF1 loss, by increasing RAS/MAPK activity, modulates FOSL1 expression, which in turn plays a central function in the regulation of MES GBM. Using a surrogate mouse model of MES GBM and patient-derived MES brain tumor stem cells (BTSCs), we show that FOSL1 is responsible for sustaining cell growth in vitro and in vivo, and for the maintenance of stem-like properties. We propose that FOSL1 is an important regulator of GBM stemness, MES features and plasticity, controlling an EMT-like process with therapeutically relevant implications.
Results
FOSL1 is a key regulator of the MES subtype
To study the tumor cell-intrinsic signaling pathways that modulate the GBM expression subtypes, we assembled a collection of transcriptomic data (both expression arrays and RNA-sequencing) of 144 samples derived from 116 independent BTSC lines (see Materials and methods for details). Samples were then classified according to the previously reported 50-gene glioma-intrinsic transcriptional subtype signatures and the single-sample gene set enrichment analysis (ssGSEA)-based equivalent distribution resampling classification strategy 87Wang et al.2017. Principal component analysis (PCA) showed a large overlap of the transcription profile among BTSCs classified either as CL/PN while most of the MES appeared as separate groups (Figure 1A and Supplementary file 1). This separation is consistent with early evidence in GSCs 10Bhat et al.2013 and holds 92% of concordance in the identification of a recent two transcriptional subgroups classification of single-GSCs defined as developmental (DEV) and injury response (INJ) 67Richards et al.2021. Differential gene expression analysis comparing mesenchymal versus non-mesenchymal BTSCs confirmed the clear separation among the two groups, with only a minor fraction of cell lines showing a mixed expression profile (Figure 1B and Supplementary file 2), further supporting that GSCs exist along a major transcriptional gradient between two cellular states 10Bhat et al.201367Richards et al.2021.
library(tidyverse)
library(cowplot)

library(readxl)
library(statmod)
library(ggpubr)
library(ggrepel)
library(ggridges)
library(ggplotify)
library(reshape2)
library(survival)
library(survminer)
library(pheatmap)
library(ggraph)
library(grid)
library(devtools)
library(RColorBrewer)
library(weights)
library(hexbin)

library(Biobase)
library(GSVA)
library(limma)
library(chromVAR)
library(clusterProfiler)
library(SummarizedExperiment)
library(TxDb.Mmusculus.UCSC.mm10.knownGene)
library(karyoploteR)
library(org.Mm.eg.db)
library(org.Hs.eg.db)

source('Scripts/plotqPCR.R', echo=F)
source('Scripts/replotGSEA.R', echo=F)
source('Scripts/ggplotLimdil.R', echo=F)
source('Scripts/survPlot.R', echo=F)
source('Scripts/statePlot.R', echo=F)
source('Scripts/emaplot.R', echo=F)
source('Scripts/plotDeviationTsne2.R', echo=F)
source('Scripts/tracksPlot.R', echo=F)
set.seed(12345) #seed for reproducibility of the analysis
symnum.args <-  list(cutpoints = c(0, 0.001, 0.01, 0.05, 1),
                     symbols = c("***", "**", "*","ns")) # symbols for pvalues
black_red <- c("#000000","#E41A1C")
black_red_green <- c("#000000","#E41A1C","#4DAF4A")
gray_black <- c("#808080","#000000")
paired_black_red <- c("#000000","#666666","#E41A1C","#FB9A99")
font_size <- font("xy.text", size = 8) + font("xlab", size = 10) + font("ylab", size = 10) + font("title",size = 10)

BTSCs_exprs <- read.delim("Data/BTSCs_exprs.txt")
BTSCs_subtypes <- read.delim("Data/BTSCs_subtypes.txt")
gsea_report_all_analysis <- read.delim("Data/gsea_report_all_analysis.txt")
qPCR_data <- read.delim("Data/qPCR_data_2021.txt",
                         stringsAsFactors=FALSE)
tcga_cgga_data <- read.delim("Data/TCGA_CGGA_data_tableS4.txt")
figure_S1C_data <- read.delim("Data/Figure_S1C.txt")
figure_S1D_data <- read.delim("Data/Figure_S1D.txt")
figure_S1E_data <- read.delim("Data/Figure_S1E.txt")
figure_S2B_data <- read.delim("Data/Figure_S2B.txt")
figure_S2C_data <- read.delim("Data/Figure_S2C.txt")
load("Data/Figure_4_data.RData")
figure_4C_data <- read.delim("Data/Figure_4C.txt")
figure_4F_data <- read.delim("Data/Figure_4F.txt",
                             comment.char="#",
                             stringsAsFactors=FALSE)
gene_signatures <- read.delim("Data/gene_signatures_2021.txt") %>%
  .[-1,] %>% # exclude 1st row
  as.list(.) %>% # convert to a list
  lapply(., function(x) x[!is.na(x)]) # remove NA
figure_5A_data <- read.delim("Data/Figure_5A.txt")
figure_5B_data <- read.delim("Data/Figure_5B.txt") %>%
  mutate(Phase = factor(Phase, levels = c("G1","S","G2")))
figure_5C_data <- read.delim("Data/Figure_5C.txt")
figure_5D_expr <- read.delim("Data/NSCs_Kras_sgFosl1_exprs.txt",
                             sep = "\t", stringsAsFactors = F)
figure_5D_pdata <- read.delim("Data/NSCs_Kras_sgFosl1_pdata.txt",
                              sep = "\t", stringsAsFactors = F)
stem_diff_genes <- read.delim("Data/stem_diff_genes.txt", sep = "\t")
figure_5E_data <- read.delim("Data/Figure_5E.txt")
figure_6D_data <- read.delim("Data/Figure_6D.txt") %>%
  mutate(Area_scaled = Area/1e07)
figure_7C_data <- read.delim("Data/Figure_7C.txt")
figure_7D_data <- read.delim("Data/Figure_7D.txt")
figure_7E_data <- read.delim("Data/Figure_7E.txt")
figure_7F_data <- read.delim("Data/Figure_7F.txt",
                             stringsAsFactors=FALSE)
figure_7F_annotation <- read.delim("Data/Figure_7F_annotation.txt",
                             stringsAsFactors=FALSE)
figure_7G_data <- read.delim("Data/Figure_7G.txt",
                             stringsAsFactors=FALSE)
figure_S7A_data <- read.delim("Data/Figure_S7A.txt")
figure_S8B_data <- read.delim("Data/Figure_S8B.txt")
figure_S8C_data <- read.delim("Data/Figure_S8C.txt")
figure_S8D_data <- read.delim("Data/Figure_S8D.txt")
figure_S8G_data <- read.delim("Data/Figure_S8G.txt")
figure_S8I_data <- read.delim("Data/Figure_S8I.txt")
figure_S8K_data <- read.delim("Data/Figure_S8K.txt")

################################################################
# Data Processing:
# 1. Data were downloaded from GEO
# 2. Common probes among platform were selected
# 3. Subtypes were calculated using `runSsGSEAwithPermutation` with 1000 permutation (set.seed(12345))
# 4. Each dataset was normalized (mean = 0, sd = 1)
# 5. Datasets were then combined in one single dataset

print("Setup and load data")
BTSCs_subtypes  <-  BTSCs_subtypes %>%
  mutate(concordant_subtype = case_when(Richards_2021 == "INJ" & Wang_2017 != "MES" ~ "NO",
                                        TRUE ~ "YES"))
row.names(BTSCs_subtypes) <- BTSCs_subtypes$accession_ID

BTSCs_eset <- ExpressionSet(assayData = as.matrix(BTSCs_exprs),
                                 phenoData=as(BTSCs_subtypes, "AnnotatedDataFrame"))
BTSCs_eset$Group <- ifelse(pData(BTSCs_eset)$Wang_2017 == "MES", "MES", "Non-MES")

###############################################################
# PCA
pdata  <-  pData(BTSCs_eset)
edata <-  exprs(BTSCs_eset)
pc  <-  prcomp(t(edata))
pc_matrix <- data.frame(pc$x)
percentage <- round(pc$sdev^2/ sum(pc$sdev^2) * 100, 2)
percentage <- paste(colnames(pc_matrix), "(",
                    paste(as.character(percentage), "%", ")", sep=""),sep = "")

pc_matrix$Wang_2017 <- pdata$Wang_2017
pc_matrix$Richards_2021 <- pdata$Richards_2021
pc_matrix$Dataset <- pdata$dataset
pc_matrix$Concordant <- pdata$concordant_subtype

figure_1a_left <- pc_matrix %>%
  ggscatter(x = "PC2", y = "PC1", size = 0.8,
            color = "Wang_2017", shape = "Dataset",
            palette = "Set1", ellipse = TRUE,
            xlab = percentage[2],
            ylab = percentage[1],
            title = "Wang_2017",
            legend = "right") +
  font_size +
  scale_shape_manual(values=seq(0,7))

figure_1a_left <- ggpar(figure_1a_left, font.legend = c(8,"plain","black"))

figure_1a_right <- pc_matrix %>%
  ggscatter(x = "PC2", y = "PC1", size = 0.8,
            color = "Richards_2021", shape = "Dataset",
            palette = brewer.pal(9, "Set1")[4:5], ellipse = TRUE,
            xlab = percentage[2],
            ylab = percentage[1],
            title = "Richards_2021",
            legend = "right") +
  font_size + rremove("ylab") +
  scale_shape_manual(values=seq(0,7))

figure_1a_right <- ggpar(figure_1a_right, font.legend = c(8,"plain","black"))

figure_1a <- ggarrange(figure_1a_left,figure_1a_right, nrow = 1, common.legend = T)
figure_1a
Principal component (PC) analysis of the brain tumor stem cells (BTSCs) expression dataset.
###############################################################
# DEG analysis
# limma
BTSCs_eset_sel <- BTSCs_eset[, BTSCs_eset$concordant_subtype == "YES"]
sml <- ifelse(pData(BTSCs_eset_sel)[,"Group"] == "MES","G1","G0")
fl <- as.factor(sml)
BTSCs_eset_sel$description <- fl
design <- model.matrix(~ description + 0 + dataset, BTSCs_eset_sel) # include dataset to correct for batch effect
fit <- lmFit(BTSCs_eset_sel, design)
cont.matrix <- makeContrasts(descriptionG1-descriptionG0, levels=design)
fit2 <- contrasts.fit(fit, cont.matrix)
fit2 <- eBayes(fit2, 0.01)

combo_eset_tT <- topTable(fit2, adjust="fdr",
                          sort.by="logFC",
                          p.value = 0.05,
                          number=100) %>%
  rownames_to_column(var = "Gene.Symbol") %>%
  arrange(-logFC)

combo_eset_tT_all <- topTable(fit2, adjust="fdr",
                              sort.by="logFC",
                              p.value = 0.05,
                              n=Inf) %>%
  rownames_to_column(var = "Gene.Symbol") %>%
  arrange(-logFC)

# heatmap
combo_eset_expr <- exprs(BTSCs_eset_sel)[combo_eset_tT$Gene.Symbol,]
combo_eset_annotation <- pData(BTSCs_eset_sel)[,c("dataset", "Wang_2017", "Richards_2021")]
names(combo_eset_annotation) <- c("Dataset", "Wang_2017", "Richards_2021")
combo_colors <- list(Dataset = brewer.pal(8, "Set2")[1:6],
                     Wang_2017 = brewer.pal(9, "Set1")[1:3],
                     Richards_2021 = brewer.pal(9, "Set1")[4:5])
names(combo_colors$Dataset) <- levels(factor(combo_eset_annotation$Dataset))
names(combo_colors$Wang_2017) <- levels(factor(combo_eset_annotation$Wang_2017))
names(combo_colors$Richards_2021) <- levels(factor(combo_eset_annotation$Richards_2021))

figure_1b <- pheatmap(t(combo_eset_expr),
                      annotation_row = combo_eset_annotation,
                      scale = "column",
                      clustering_distance_rows = "correlation",
                      show_rownames = F,
                      show_colnames = T,
                      fontsize_col = 5,
                      border_color = NA,
                      cluster_col = F, cluster_rows  = T,
                      annotation_colors = combo_colors,
                      # cutree_rows = 3,
                      color = colorRampPalette(c("steelblue","white","red"))(100),
                      silent = T)
figure_1b
Heatmap of the top 100 differentially expressed genes between MES and non-MES BTSCs.
#############################################
BTSCs_df <- merge(pData(BTSCs_eset_sel),
                       t(exprs(BTSCs_eset_sel)),
                       by = "row.names")

sub_comparisons <- list( c("MES", "PN"),
                         c("MES", "CL"),
                         c("CL", "PN"))

figure_1d_left <- BTSCs_df %>%
  ggboxplot(x = "Wang_2017", y = "FOSL1",
            color = "Wang_2017",
            palette = brewer.pal(9, "Set1")[1:3],
            outlier.size = 0, outlier.stroke = 0,
            add = "jitter", add.params = list(shape = "dataset"),
            ylab = "FOSL1 mRNA (A.U.)",
            ylim = c(-2,4.5),
            legend = "right") + font_size +
  theme(legend.position = "none") +
  rremove("xlab") +
  scale_shape_manual(values = seq(0,7)) +
  stat_compare_means(comparisons = sub_comparisons,
                     symnum.args =  symnum.args,
                     method = "t.test")
figure_1d_left <- ggpar(figure_1d_left, font.legend = c(8,"plain","black"))

# #t-test
# BTSCs_df %>%
#    compare_means(FOSL1 ~ Wang_2017,
#                  comparisons = sub_comparisons,
#                  symnum.args =  symnum.args,
#                  method = "t.test",
#                  data = .)
#
# #Anova with Tukey post-hoc
# BTSCs_df %>%
#   aov(FOSL1 ~ Wang_2017, data = .) %>%
#   TukeyHSD() %>% .$Wang_2017

figure_1d_right <- BTSCs_df %>%
  ggboxplot(x = "Richards_2021", y = "FOSL1",
            color = "Richards_2021",
            palette = brewer.pal(9, "Set1")[4:5],
            outlier.size = 0, outlier.stroke = 0,
            add = "jitter", add.params = list(shape = "dataset"),
            ylab = "FOSL1 mRNA (A.U.)",
            ylim = c(-2,4.5),
            legend = "right") + font_size +
  rremove("xlab") + rremove("ylab") +
  theme(legend.position = "none") +
  scale_shape_manual(values = seq(0,7)) +
  stat_compare_means(comparisons = list(c("DEV", "INJ")),
                     symnum.args =  symnum.args,
                     label.y = 4,
                     method = "t.test")

figure_1d_right <- ggpar(figure_1d_right, font.legend = c(8,"plain","black"))

figure_1d <- plot_grid(figure_1d_left, figure_1d_right, nrow = 1, rel_widths = c(1, 0.7))
figure_1d
FOSL1 mRNA expression in the BTSCs dataset.
One-way ANOVA with Tukey multiple pairwise comparison, ***p≤0.001, ns = not significant.
mol_comparison <- list(c("IDHmut-codel","IDHmut-non-codel"),
                       c("IDHmut-codel","IDHwt"),
                       c("IDHmut-non-codel","IDHwt"))

figure_1e <- tcga_cgga_data %>%
  group_by(dataset) %>%
  mutate(FOSL1 = scale(FOSL1),
         IDH_codel.subtype = factor(IDH_codel.subtype,
         levels = c("IDHmut-codel","IDHmut-non-codel","IDHwt"))) %>%
  filter(., IDH_codel.subtype!=is.na(IDH_codel.subtype)) %>%
  ggboxplot(x = "IDH_codel.subtype", y = "FOSL1",
            outlier.size = 0, outlier.stroke = 0,
            add = "jitter",
            add.params = list(size = 0.6, alpha = 0.3),
            facet.by = "dataset", ylim = c(-3,6),
            ylab = "FOSL1 mRNA (A.U.)") +
  font_size + rremove("xlab") +
  scale_x_discrete(labels=function(x){sub("\\-", "\n", x)}) +
  stat_compare_means(method = "t.test", comparison = mol_comparison,
                     label.y = c(3.25,4.25,5.5),label = "p.signif",
                     symnum.args = symnum.args)

# # To get the statistic
# tcga_cgga_data %>%
#   dplyr::filter(., IDH_codel.subtype!=is.na(IDH_codel.subtype)) %>%
#   compare_means(FOSL1 ~ IDH_codel.subtype, method = "t.test", data = .,symnum.args = symnum.args, group.by = "dataset")
#
# #Anova with Tukey post-hoc
# tcga_cgga_data %>%
#   dplyr::filter(., dataset == "CGGA", IDH_codel.subtype!=is.na(IDH_codel.subtype)) %>%
#   mutate(FOSL1 = scale(FOSL1)) %>%
#   aov(FOSL1 ~ IDH_codel.subtype, data = .) %>%
#   TukeyHSD() %>% .$IDH_codel.subtype
#
# tcga_cgga_data %>%
#   dplyr::filter(., dataset == "TCGA", IDH_codel.subtype!=is.na(IDH_codel.subtype)) %>%
#   mutate(FOSL1 = scale(FOSL1)) %>%
#   aov(FOSL1 ~ IDH_codel.subtype, data = .) %>%
#   TukeyHSD() %>% .$IDH_codel.subtype

figure_1e
FOSL1 mRNA expression in the CGGA and TCGA datasets. Tumors were separated according to their molecular subtype classification. One-way ANOVA with Tukey multiple pairwise comparison, ***p≤0.001.
# Panel 1f, survival
figure_1f_left <- survPlot(subset(tcga_cgga_data, dataset == "CGGA")) +
  ggtitle("CGGA")
figure_1f_right <- survPlot(subset(tcga_cgga_data, dataset == "TCGA")) +
  ggtitle("TCGA")

figure_1f <- plot_grid(figure_1f_left$plot, figure_1f_right$plot)

figure_1f
Kaplan–Meier survival curves of IDH-wt gliomas in the CGGA and TCGA datasets stratified based on FOSL1 expression (see Materials and methods for details).
# Expression data of the top 10 TF
figure_s1_data <- BTSCs_df %>%
  .[,c("dataset","Group", c("FOSL1","VDR","SP100","ELF4", "BNC2",
                            "OLIG2","SOX11","ASCL1","SALL2","POU3F3"))] %>%
  reshape2::melt(.)

figure_s1a <- figure_s1_data %>%
  ggplot(aes(x = Group, y = value)) +
  geom_boxplot(outlier.size = 0, outlier.stroke = 0) +
  geom_jitter(position = position_jitter(width = .25),
              size = 2, alpha = 0.75,
              aes(color=Group, shape = dataset)) +
  ylim(-3,5) +
  scale_color_manual(values = c("#F5AE26", "#EA549D")) +
  labs(y = "mRNA (A.U.)", x = "Subtype",
       color = "Subtype", shape = "Dataset") +
  scale_shape_manual(values=seq(0,7)) + theme_bw() +
  stat_compare_means(symnum.args = symnum.args, label.y = 4, label.x = 1.4,
                     method = "t.test", label = "p.signif") +
facet_wrap(~variable,nrow = 2,ncol = 5)

figure_s1a
mRNA expression of the top 10 scoring TFs in the MRA of the brain tumor stem cells (BTSCs) dataset, comparing mesenchymal (MES) versus non-MES. Student’s t test, ***p .001.
# figure s1c left  Richards GSCs ssGSEA score subtypes
row.names(figure_S1C_data) <- figure_S1C_data$Sample
subtypes_annotation <- figure_S1C_data[,c("Richards_2021","Wang_2017")]
subtypes_gsea_colors <- list(Wang_2017 = brewer.pal(8, "Set1")[1:3],
                    Richards_2021 = brewer.pal(9, "Set1")[4:5])
names(subtypes_gsea_colors$Wang_2017) <- levels(factor(subtypes_annotation$Wang_2017))
names(subtypes_gsea_colors$Richards_2021) <- levels(factor(subtypes_annotation$Richards_2021))

figure_s1c_left  <- pheatmap(t(figure_S1C_data[2:6]),
         annotation_col = subtypes_annotation,
         scale = "row",
         clustering_distance_cols = "correlation",
         show_colnames = F, fontsize_col = 5,
         border_color = NA,
         cluster_col = T, cluster_rows  = F,
         annotation_colors = subtypes_gsea_colors,
         color = colorRampPalette(c("steelblue","white","red"))(100),
         silent = T)

# figure s1c right FOSL1 expression Richards GSCs
figure_s1c_right_a <- figure_S1C_data %>%
  subset(., Wang_2017 != is.na(Wang_2017)) %>%
  ggboxplot(x = "Wang_2017", y = "FOSL1",
            color = "Wang_2017",
            palette = brewer.pal(9, "Set1")[1:3],
            outlier.size = 0, outlier.stroke = 0,
            add = "jitter", ylim = c(5,18),
            ylab = "FOSL1 mRNA (A.U.)",
            legend = "right") +
  theme(legend.position = "none") + font_size + ggtitle("") +
  rremove("xlab") +
  stat_compare_means(comparisons = list( c("MES", "PN"),
                                         c("MES", "CL"),
                                         c("CL", "PN")),
                     symnum.args =  symnum.args,
                     method = "t.test")
figure_s1c_right_a <- ggpar(figure_s1c_right_a, font.legend = c(8,"plain","black"))

figure_s1c_right_b <- figure_S1C_data %>%
  subset(., Wang_2017 != is.na(Wang_2017)) %>%
  ggboxplot(x = "Richards_2021", y = "FOSL1",
         color = "Richards_2021",
         palette = brewer.pal(9, "Set1")[4:5],
         outlier.size = 0, outlier.stroke = 0,
         add = "jitter",ylim = c(5,18),
         ylab = "FOSL1 mRNA (A.U.)",
         legend = "right") + font_size + ggtitle("") +
  rremove("xlab") + rremove("ylab") +
  theme(legend.position = "none") +
  stat_compare_means( comparisons = list(c("DEV", "INJ")),
                     symnum.args =  symnum.args,
                     method = "t.test")
figure_s1c_right_b <- ggpar(figure_s1c_right_b, font.legend = c(8,"plain","black"))

figure_s1c <- plot_grid(figure_s1c_left$gtable,
                        figure_s1c_right_a,
                        figure_s1c_right_b,
                        nrow = 1, rel_widths = c(3,1, 0.7))
figure_s1c
FOSL1 mRNA expression in the Richards glioma stem cells (GSCs) bulk RNA-seq dataset (n = 72; right panel).
Single-sample gene set enrichment analys (ssGSEA) was performed to identify the GSCs subtypes (left panel). Tumors were separated according to their expression subtype classification. One-way ANOVA with Tukey multiple pairwise comparison, ***p≤0.001, **p≤0.01, ns = not significant.
# figure s1d ssGSEA score Richards GSCs scRNAseq
figure_S1D_data_long <-  pivot_longer(data = figure_S1D_data[,-1],
                                 cols = Richards_DEV_2021:Wang_CL_2017)

figure_s1d <- figure_S1D_data_long %>%
  mutate(name = factor(name, levels=c("Wang_CL_2017","Wang_PN_2017","Wang_MES_2017",
                                      "Richards_DEV_2021", "Richards_INJ_2021"))) %>%
  ggplot(aes(x = X, y = Y)) +
  geom_point(aes(color = value), alpha = 0.75, size = 0.5) +
  labs(x="PC1",y="PC2") +
  scale_colour_gradient2(low="blue", midpoint = 0.35, high="red") +
  theme_bw() +
  facet_wrap(~name, nrow = 1)

figure_s1d
ssGSEA scores of the Wang_2017 and Richards_2021 transcriptional subtypes performed on the scRNA-seq GSCs data (65,655 cells from 28 samples) from 67Richards et al.2021.
# figure s1e Top 10 TFs Richards GSCs scRNAseq
figure_S1E_data_long <- pivot_longer(data = figure_S1E_data[,-1],cols = FOSL1:POU3F3) %>%
  mutate(name = factor(name, levels = c("FOSL1","VDR","SP100","ELF4", "BNC2", "OLIG2","SOX11","ASCL1","SALL2","POU3F3")),
         group = case_when(name %in% c("FOSL1","VDR","SP100","ELF4", "BNC2") ~ 'MES',
                           name %in% c("OLIG2","SOX11","ASCL1","SALL2","POU3F3") ~ 'Non-MES'))

# two-dimensional state plot
figure_s1e <- figure_S1E_data_long %>%
  ggplot(aes(x = X, y = Y)) +
  geom_point(aes(color = value), alpha = 0.75, size = 0.5) +
  labs(x="PC1",y="PC2") +
  theme_bw() +
  facet_wrap(.~name, nrow = 2) +
  scale_color_gradient2(low = "white", mid = "#FFFFCC", high = "red")

figure_s1e
mRNA expression of the top 10 scoring TFs on the scRNA-seq GSCs data from 67Richards et al.2021.
# figure s2a FOSL1 expression CGGA and TCGA stratified by subtypes
sub_comparisons <- list( c("MES", "PN"),
                         c("MES", "CL"),
                         c("CL", "PN"))

figure_s2a_left <- tcga_cgga_data %>%
  .[!is.na(.$Wang_2017),] %>%
  group_by(dataset) %>%
  mutate(FOSL1 = scale(FOSL1),
         Wang_2017 = factor(Wang_2017, levels= c("CL","MES","PN"))) %>%
  filter(., IDH_codel.subtype == "IDHwt") %>%
  ggboxplot(x = "Wang_2017", y = "FOSL1",
            color = "Wang_2017",
            palette = brewer.pal(9, "Set1")[1:3],
            outlier.size = 0, outlier.stroke = 0,
            add = "jitter",
            add.params = list(size = 0.8, alpha = 0.5),
            facet.by = "dataset", ylim = c(-3,4),
            ylab = "FOSL1 mRNA (A.U.)") +
  font_size + rremove("xlab") +
  stat_compare_means(comparisons = sub_comparisons,
                     symnum.args =  symnum.args,
                     method = "t.test")

figure_s2a_left <- ggpar(figure_s2a_left, font.legend = c(8,"plain","black"))

# #Anova with Tukey post-hoc
# tcga_cgga_data %>%
#   .[!is.na(.$Wang_2017),] %>%
#   group_by(dataset) %>%
#   mutate(FOSL1 = scale(FOSL1),
#          Wang_2017 = factor(Wang_2017, levels= c("CL","MES","PN"))) %>%
#   filter(., IDH_codel.subtype == "IDHwt") %>%
#   aov(FOSL1 ~ Wang_2017, data = .) %>%
#   TukeyHSD() %>% .$Wang_2017

figure_s2a_right <- tcga_cgga_data %>%
  .[!is.na(.$Richards_2021),] %>%
  group_by(dataset) %>%
  mutate(FOSL1 = scale(FOSL1),
         Richards_2021 = factor(Richards_2021, levels= c("DEV","INJ"))) %>%
  filter(., IDH_codel.subtype == "IDHwt") %>%
  ggboxplot(x = "Richards_2021", y = "FOSL1",
            color = "Richards_2021",
            palette = brewer.pal(9, "Set1")[4:5],
            outlier.size = 0, outlier.stroke = 0,
            add = "jitter",
            add.params = list(size = 0.8, alpha = 0.5),
            facet.by = "dataset", ylim = c(-3,4),
            ylab = "FOSL1 mRNA (A.U.)") +
  font_size + rremove("xlab") +
  stat_compare_means(comparisons = list(c("DEV", "INJ")),
                     symnum.args =  symnum.args,
                     method = "t.test")

figure_s2a_right <- ggpar(figure_s2a_right, font.legend = c(8,"plain","black"))

figure_s2a <- plot_grid(figure_s2a_left, figure_s2a_right)
figure_s2a
FOSL1 mRNA expression in IDH-wt tumors of the CGGA and TCGA datasets.
Tumors were separated according to their expression subtype classification. One-way ANOVA with Tukey multiple pairwise comparison, ***p≤0.001, **p≤0.01, ns = not significant.
# figure s2b ssGSEA score Neftel tumor scRNAseq
figure_S2B_data_long <- pivot_longer(data = figure_S2B_data[,-1],
                                    cols = Richards_DEV_2021:Wang_CL_2017)
figure_s2b <- figure_S2B_data_long %>%
  mutate(name = factor(name, levels=c("Wang_CL_2017","Wang_PN_2017","Wang_MES_2017",
                                      "Richards_DEV_2021","Richards_INJ_2021"))) %>%
  ggplot(aes(x = X, y = Y)) +
  geom_point(aes(color = value), alpha = 0.75, size = 0.5) +
  ylim(-2.75,2.75) + xlim(-2.75,2.75)+
  geom_hline(yintercept = 0, size = 0.25) +
  geom_vline(xintercept = 0, size = 0.25) +
  labs(x="",y="") +
  scale_colour_gradient2(low="blue", midpoint = 0.5, high="red") +
  theme_bw() +
  theme(axis.ticks.length=unit(0, "cm"), axis.text.x=element_blank(),
        axis.text.y=element_blank()) +
  facet_wrap(.~name, nrow =1)

figure_s2b
Single-sample gene set enrichment analysis (ssGSEA) scores of the Wang_2017 and Richards_2021 transcriptional subtypes performed on the scRNA-seq data (6863 cells) from 60Neftel et al.2019.
# figure s2c Top 10 TFs Neftel tumor scRNAseq, hexbins on scaled expression
figure_S2C_data_long <- pivot_longer(data = figure_S2C_data[,-1],cols = FOSL1:POU3F3)

figure_s2c <- figure_S2C_data_long %>%
  mutate(name = factor(name, levels= c("FOSL1","VDR","SP100","ELF4", "BNC2", "OLIG2","SOX11","ASCL1","SALL2","POU3F3"))) %>%
  ggplot(aes(x = X, y = Y, z = value)) +
  stat_summary_hex(bins=100, fun = "median") +
  ylim(-2.75,2.75) + xlim(-2.75,2.75)+
  geom_hline(yintercept = 0, size = 0.25) +
  geom_vline(xintercept = 0, size = 0.25) +
  labs(x="",y="") +
  scale_fill_gradientn(colours = c(brewer.pal(n = 8, name = "YlOrRd"))) +
  theme_bw() +
  theme(axis.ticks.length=unit(-0.1, "cm"), axis.text.x=element_blank(),
        axis.text.y=element_blank()) +
  facet_wrap(.~name,nrow = 2,ncol = 5)

figure_s2c
Normalized mRNA expression of the top 10 scoring TFs on the scRNA-seq tumor data from 60Neftel et al.2019.
To reveal the signaling pathways underlying the differences between MES and non-MES BTSCs, we then applied a network-based approach based on the Algorithm for the Reconstruction of Accurate Cellular Networks (ARACNe) 6Basso et al.200515Carro et al.2010, which identifies a list of TFs with their predicted targets, defined as regulons. The regulon for each TF is constituted by all the genes whose expression data exhibit significant mutual information with that of a given TF and are thus expected to be regulated by that TF 17Castro et al.201631Fletcher et al.2013. Enrichment of a relevant gene signature in each of the regulons can point to the TFs acting as master regulators (MRs) of the response or phenotype 15Carro et al.201031Fletcher et al.2013. Master regulator analysis (MRA) identified a series of TFs, among which FOSL1, VDR, OLIG2, SP100, ELF4, SOX11, BNC2, ASCL1, SALL2, and POU3F3 were the top 10 most statistically significant (Benjamini–Hochberg p<0.0001) (Figure 1C and Supplementary file 3). FOSL1, VDR, SP100, ELF4, and BNC2 were significantly upregulated in the MES BTSCs, while OLIG2, SOX11, ASCL1, SALL2, and POU3F3 were upregulated in the non-MES BTSCs (Figure 1D and Figure 1—figure supplement 1A). Gene set enrichment analysis (GSEA) evidenced how the regulons for the top 10 TFs are enriched for genes that are differentially expressed among the two classes (MES and non-MES) with FOSL1 having the highest enrichment score (Figure 1C, Figure 1—figure supplement 1B, and Supplementary file 3). Lastly, an analysis of an independent BTSCs dataset 67Richards et al.2021 evidenced that the differential expression of FOSL1 and the other TFs was maintained both at bulk (Figure 1—figure supplement 1C) and at a single-cell level (Figure 1—figure supplement 1D, E).
We then analyzed the CGGA and TCGA pan-glioma datasets 18Ceccarelli et al.201696Zhao et al.2017 and observed that FOSL1 expression is elevated in the IDH-wt glioma molecular subgroup (Figure 1E and Supplementary file 4) with a significant upregulation in the MES subtype in bulk tumors, and it is also enriched in MES-like cells 60Neftel et al.2019 at the single-cell level (Figure 1—figure supplement 2A–C). Importantly, high expression levels were associated with worse prognosis in IDH-wt tumors (Figure 1F), thus suggesting that FOSL1 could represent not only a key regulator of the glioma-intrinsic MES signature, but also a putative key player in MES glioma pathogenesis.
NF1 modulates the MES signature and FOSL1 expression
NF1 alterations and activation of the RAS/MAPK signaling have been previously associated with the MES GBM subtype 12Brennan et al.201385Verhaak et al.201086Wang et al.201687Wang et al.2017. However, whether NF1 plays a broader functional role in the regulation of the MES gene signature (MGS) in IDH-wt gliomas still remains to be established.
We initially grouped, according to the previously described GBM subtype-specific gene signatures, a subset of IDH-wt glioma samples of the TCGA dataset for which RNA-seq data were available (n = 229) (see Materials and methods for details). By analyzing the frequency of NF1 alterations (either point mutations or biallelic gene loss), we confirmed a significant enrichment of NF1 alterations in MES versus non-MES tumors (Fisher’s exact test p=0.0106) (Figure 2A, B). Importantly, we detected higher level of FOSL1 mRNA in the cohort of IDH-wt gliomas with NF1 alterations (Student’s t test p=0.018) (Figure 2C), as well as a significant negative correlation between FOSL1 and NF1 mRNA levels (Pearson R = −0.44, p=7.8e-12) (Figure 2D and Supplementary file 4).
# select only TCGA IDH-wt samples
tcga_idwt_samples <- as.character(
  filter(tcga_cgga_data, dataset == "TCGA" &
           IDH_codel.subtype == "IDHwt")$Sample)

# ssGSEA values
tumor_gsva_annotation <- tcga_cgga_data %>%
  filter(dataset == "TCGA" & IDH_codel.subtype == "IDHwt") %>%
  .[ ,c("Sample", "Wang_2017","Richards_2021","NF1_status")] %>%
  mutate(NF1_status = factor(NF1_status),
         Wang_2017 = factor(Wang_2017),
         Richards_2021 = factor(Richards_2021)) %>%
  arrange(Richards_2021, Wang_2017, NF1_status) %>%
  column_to_rownames("Sample")

tumor_gsva_colors <- list(Wang_2017 = brewer.pal(9, "Set1")[1:3],
                          Richards_2021 = brewer.pal(9, "Set1")[4:5],
                          NF1_status = c("#FC8D62","#66C2A5"))
names(tumor_gsva_colors$Wang_2017) <- levels(tumor_gsva_annotation$Wang_2017)
names(tumor_gsva_colors$Richards_2021) <- levels(tumor_gsva_annotation$Richards_2021)
names(tumor_gsva_colors$NF1_status) <- levels(tumor_gsva_annotation$NF1_status)

tumor_data <- tcga_cgga_data %>%
  filter(dataset == "TCGA" & IDH_codel.subtype == "IDHwt") %>%
  .[,c("Sample","Developmental_ssGSEA","Injury_ssGSEA",
       "Classical_ssGSEA","Mesenchymal_ssGSEA","Proneural_ssGSEA")] %>%
  column_to_rownames("Sample")

tumor_data <- tumor_data[row.names(tumor_gsva_annotation),]
figure_2a <- pheatmap(t(tumor_data),
                      scale = "row",
                      cluster_cols = F,
                      cluster_rows = F,
                      annotation_col = tumor_gsva_annotation,
                      show_colnames = F, fontsize_row = 8,
                      border_color = NA,
                      annotation_colors = tumor_gsva_colors,
                      clustering_distance_cols = "correlation",
                      color = colorRampPalette(c("steelblue","white","red"))(100),
                      silent = T)

figure_2a
Heatmap of the subtypes single-sample gene set enrichment analysis (ssGSEA) scores and NF1 genetic alterations of the IDH-wt gliomas in the TCGA dataset.
tumor_NF1_status <- tumor_gsva_annotation %>%
  mutate(concordant_subtype = case_when(Richards_2021 == "INJ" & Wang_2017 != "MES" ~ "NO",
                                        Wang_2017 == "MES" & Richards_2021 != "INJ" ~ "NO",
                                        TRUE ~ "YES")) %>%
  filter(concordant_subtype == "YES") %>%
  mutate(MES_status = ifelse(Richards_2021 == "INJ","MES","Non-MES"))

fisher <- fisher.test(table(tumor_NF1_status$NF1_status,
                            tumor_NF1_status$MES_status),
                      alternative="two.sided")

figure_2b_data <- table(tumor_NF1_status$MES_status, tumor_NF1_status$NF1_status) %>%
  reshape2::melt(., varnames = c("Subtype_group","NF1_status"), id.vars = "Subtype_group")

figure_2b <- figure_2b_data %>%
  group_by(Subtype_group) %>%
  mutate(perc = round(value/sum(value),2)*100) %>%
  ggplot(aes(x = Subtype_group, y = perc,
             fill = NF1_status, cumulative = TRUE)) +
  geom_col(width = 0.75) +  ylab("percentage") +
  theme_pubr(legend = "none") + font_size +
  scale_fill_manual(values = c("#FC8D62","#66C2A5")) +
  geom_text(aes(label = paste0(perc,"%")),
            position = position_stack(vjust = 0.5),
            color = "white", size = 3.5) +
  ggtitle(sprintf("Fisher's exact test:\n P value = %s",
                  signif(fisher$p.value,digits = 4)))

figure_2b <- ggpar(figure_2b, font.main = c(8,"black","plain"))

figure_2b
Frequency of NF1 alterations in MES and non-MES IDH-wt gliomas.
idhwt_nf1_data <- tcga_cgga_data %>%
  filter(.,dataset == "TCGA" &
           IDH_codel.subtype == "IDHwt" &
           NF1_status!=is.na(NF1_status)) %>%
  mutate(NF1_status = factor(NF1_status, levels = c("NotAltered","Altered")))

# Panel 2c, NF1_status
figure_2c <- idhwt_nf1_data %>%
  ggboxplot(x = "NF1_status", y = "FOSL1",
            add = "jitter",
            outlier.size = 0, outlier.stroke = 0,
            add.params = list(color = "NF1_status",
                              size = 0.8, alpha = 0.5),
            palette = "Set2", legend = "none", title ="",
            ylab = "FOSL1 mRNA (log2)",
            xlab = "NF1 status") + font_size +
  stat_compare_means(method = "t.test", label = "p.format")

# idhwt_nf1_data %>%
#   compare_means(FOSL1 ~ NF1_status, method = "t.test",
#                 data = .,symnum.args = symnum.args)

figure_2c
FOSL1 mRNA expression in IDH-wt gliomas, stratified according to NF1 alterations.
# Panel 2d, NF1mRNA correlation
figure_2d <- idhwt_nf1_data %>%
  ggscatter(x = "NF1", y = "FOSL1", color = "NF1_status",
            palette = "Set2", alpha = 0.5, size = 0.8,
            add = "reg.line", # Add regression line
            add.params = list(color = "black", fill = "gray"),
            conf.int = TRUE, # Add confidence interval
            cor.coef = TRUE,
            legend = "none", title = "",
            cor.coeff.args = list(method = "pearson",
                                  label.x = 8, label.y = 3.5,
                                  label.sep = "\n"),
            ylab = "FOSL1 mRNA (log2)",
            xlab = "NF1 mRNA (log2)") + font_size

# idhwt_nf1_data %>%  do(tidy(cor.test(.$NF1, .$FOSL1)))

figure_2d
Correlation of FOSL1 and NF1 mRNA expression in IDH-wt gliomas. Pearson correlation, R = −0.044, p=7.8e-12.
figure_2e <- qPCR_data %>%
  plotqPCR(panel = "2E",
           normalizer = "18s",
           ref_group = "Ctrl",
           levels =c("Ctrl","GRD"),
           pvalue = T,
           facet_by = "Cells",
           legend = "none", palette = black_red,
           ylim = c(0,1.25),
           ylab = "FOSL1 mRNA (A.U.)")

figure_2e
qRT-PCR analysis of FOSL1 expression upon NF1-GRD overexpression in BTSC 232 and BTSC 233 cells.
figure_2g <- gsea_report_all_analysis %>%
  filter(Analysis == "BTSC233_NF1_GRD") %>%
  ggplot(aes(x = reorder(NAME,NES), y = NES)) +
  geom_col(aes(fill = TYPE, color =`FDR.q.val`<0.05), width = 0.75) +
  coord_flip() + xlab("") +
  theme_cowplot() + theme(axis.text.y=element_text(size = 7)) +
  scale_fill_manual(values = c("#F5AE26", "#EA549D")) +
  scale_color_manual(values = c("gray","black"))

figure_2g
Gene set enrichment analysis (GSEA) results of BTSC 233 cells transduced with NF1-GRD expressing lentivirus versus Ctrl. NES: normalized enrichment score.
figure_2h <- qPCR_data %>%
  plot_normqPCR(panel = "2H",
                normalizer = "18s",
                ref_group = "shCtrl",
                levels = c("shCtrl","shNF1_1","shNF1_4","shNF1_5"),
                pvalue = T,
                facet_by = "Cells",
                legend = "none",
                palette = "Set1",
                ylim = c(0,2.5),
                ylab = "FOSL1 mRNA  (A.U.)")

figure_2h
qRT-PCR analysis of FOSL1 expression upon NF1 knockdown in BTSC 3021 and BTSC 3047 cells.
figure_2i <- gsea_report_all_analysis %>%
  filter(Analysis == "BTSC3021_shNF1") %>%
  ggplot(aes(x = reorder(NAME,NES), y = NES)) +
  geom_col(aes(fill = TYPE, color =`FDR.q.val`<0.05), width = 0.75) +
  coord_flip() + xlab("") +
  theme_cowplot() + theme(axis.text.y=element_text(size = 7)) +
  scale_fill_manual(values = c("#F5AE26", "#EA549D")) +
  scale_color_manual(values = c("gray","black"))

figure_2i
qRT-PCR analysis of FOSL1 expression upon NF1 knockdown in BTSC 3021 and BTSC 3047 cells.
figure_2j_left_a <- qPCR_data %>%
  filter(Cells == "BTSC 232" & Gene %in% c("18s","FOSL1")) %>%
  plotqPCR(panel = "2J",
           normalizer = "18s",
           ref_group = "Ctrl+Ctrl",
           levels = c("Ctrl+Ctrl", "Ctrl+FOSL1",
                      "GRD+Ctrl","GRD+FOSL1"),
           pvalue = F, legend = "none",
           palette = paired_black_red,
           ylab = NULL)

figure_2j_right_a <- qPCR_data %>%
  filter(Cells == "BTSC 232" & Gene != "FOSL1") %>%
  plotqPCR(panel = "2J",
           normalizer = "18s",
           ref_group = "Ctrl+Ctrl",
           levels = c("Ctrl+Ctrl", "Ctrl+FOSL1",
                      "GRD+Ctrl","GRD+FOSL1"),
           pvalue = F, legend = "right",
           palette = paired_black_red, ylab = NULL) +
  rremove("ylab")

figure_2j_left_b <- qPCR_data %>%
  filter(Cells == "BTSC 233" & Gene %in% c("18s","FOSL1")) %>%
  plotqPCR(panel = "2J",
           normalizer = "18s",
           ref_group = "Ctrl+Ctrl",
           levels = c("Ctrl+Ctrl", "Ctrl+FOSL1",
                      "GRD+Ctrl","GRD+FOSL1"),
           pvalue = F, legend = "none",
           palette = paired_black_red, ylab = NULL)

figure_2j_right_b <- qPCR_data %>%
  filter(Cells == "BTSC 233" & Gene != "FOSL1") %>%
  plotqPCR(panel = "2J",
           normalizer = "18s",
           ref_group = "Ctrl+Ctrl",
           levels = c("Ctrl+Ctrl", "Ctrl+FOSL1",
                      "GRD+Ctrl","GRD+FOSL1"),
           pvalue = F, legend = "right",
           palette = paired_black_red, ylab = NULL) +
  rremove("ylab")

figure_2j <- ggarrange(figure_2j_left_a, figure_2j_right_a,
                       figure_2j_left_b, figure_2j_right_b,
                       widths = c(0.35,1,0.35,1), nrow = 1,
                      legend = 'right',common.legend = T)

figure_2j
qRT-PCR analysis of MES genes expression upon NF1-GRD and FOSL1 co-expression in BTSC 232 and BTSC 233 cells.
qRT-PCR data in (E), (H), and (J) are presented as mean ± SD (n = 3, technical replicates), normalized to 18S rRNA expression; Student’s t test, *p≤0.05, **p≤0.01, ***p≤0.001, ns = not significant.
figure_S3d <- as.ggplot(~ replotGSEA(path = "Data/GSEA/Freiburg_BTSC233_NF1_GRD.Gsea.1557494919416",
                                     gene.set = "BILD_HRAS_ONCOGENIC_SIGNATURE", class.name = "NF1-GRD positively correlated"))

figure_S3d
Gene set enrichment analysis (GSEA) of Ras-induced oncogenic signature in BTSC 233 cells transduced with NF1-GRD expressing lentivirus versus Ctrl.
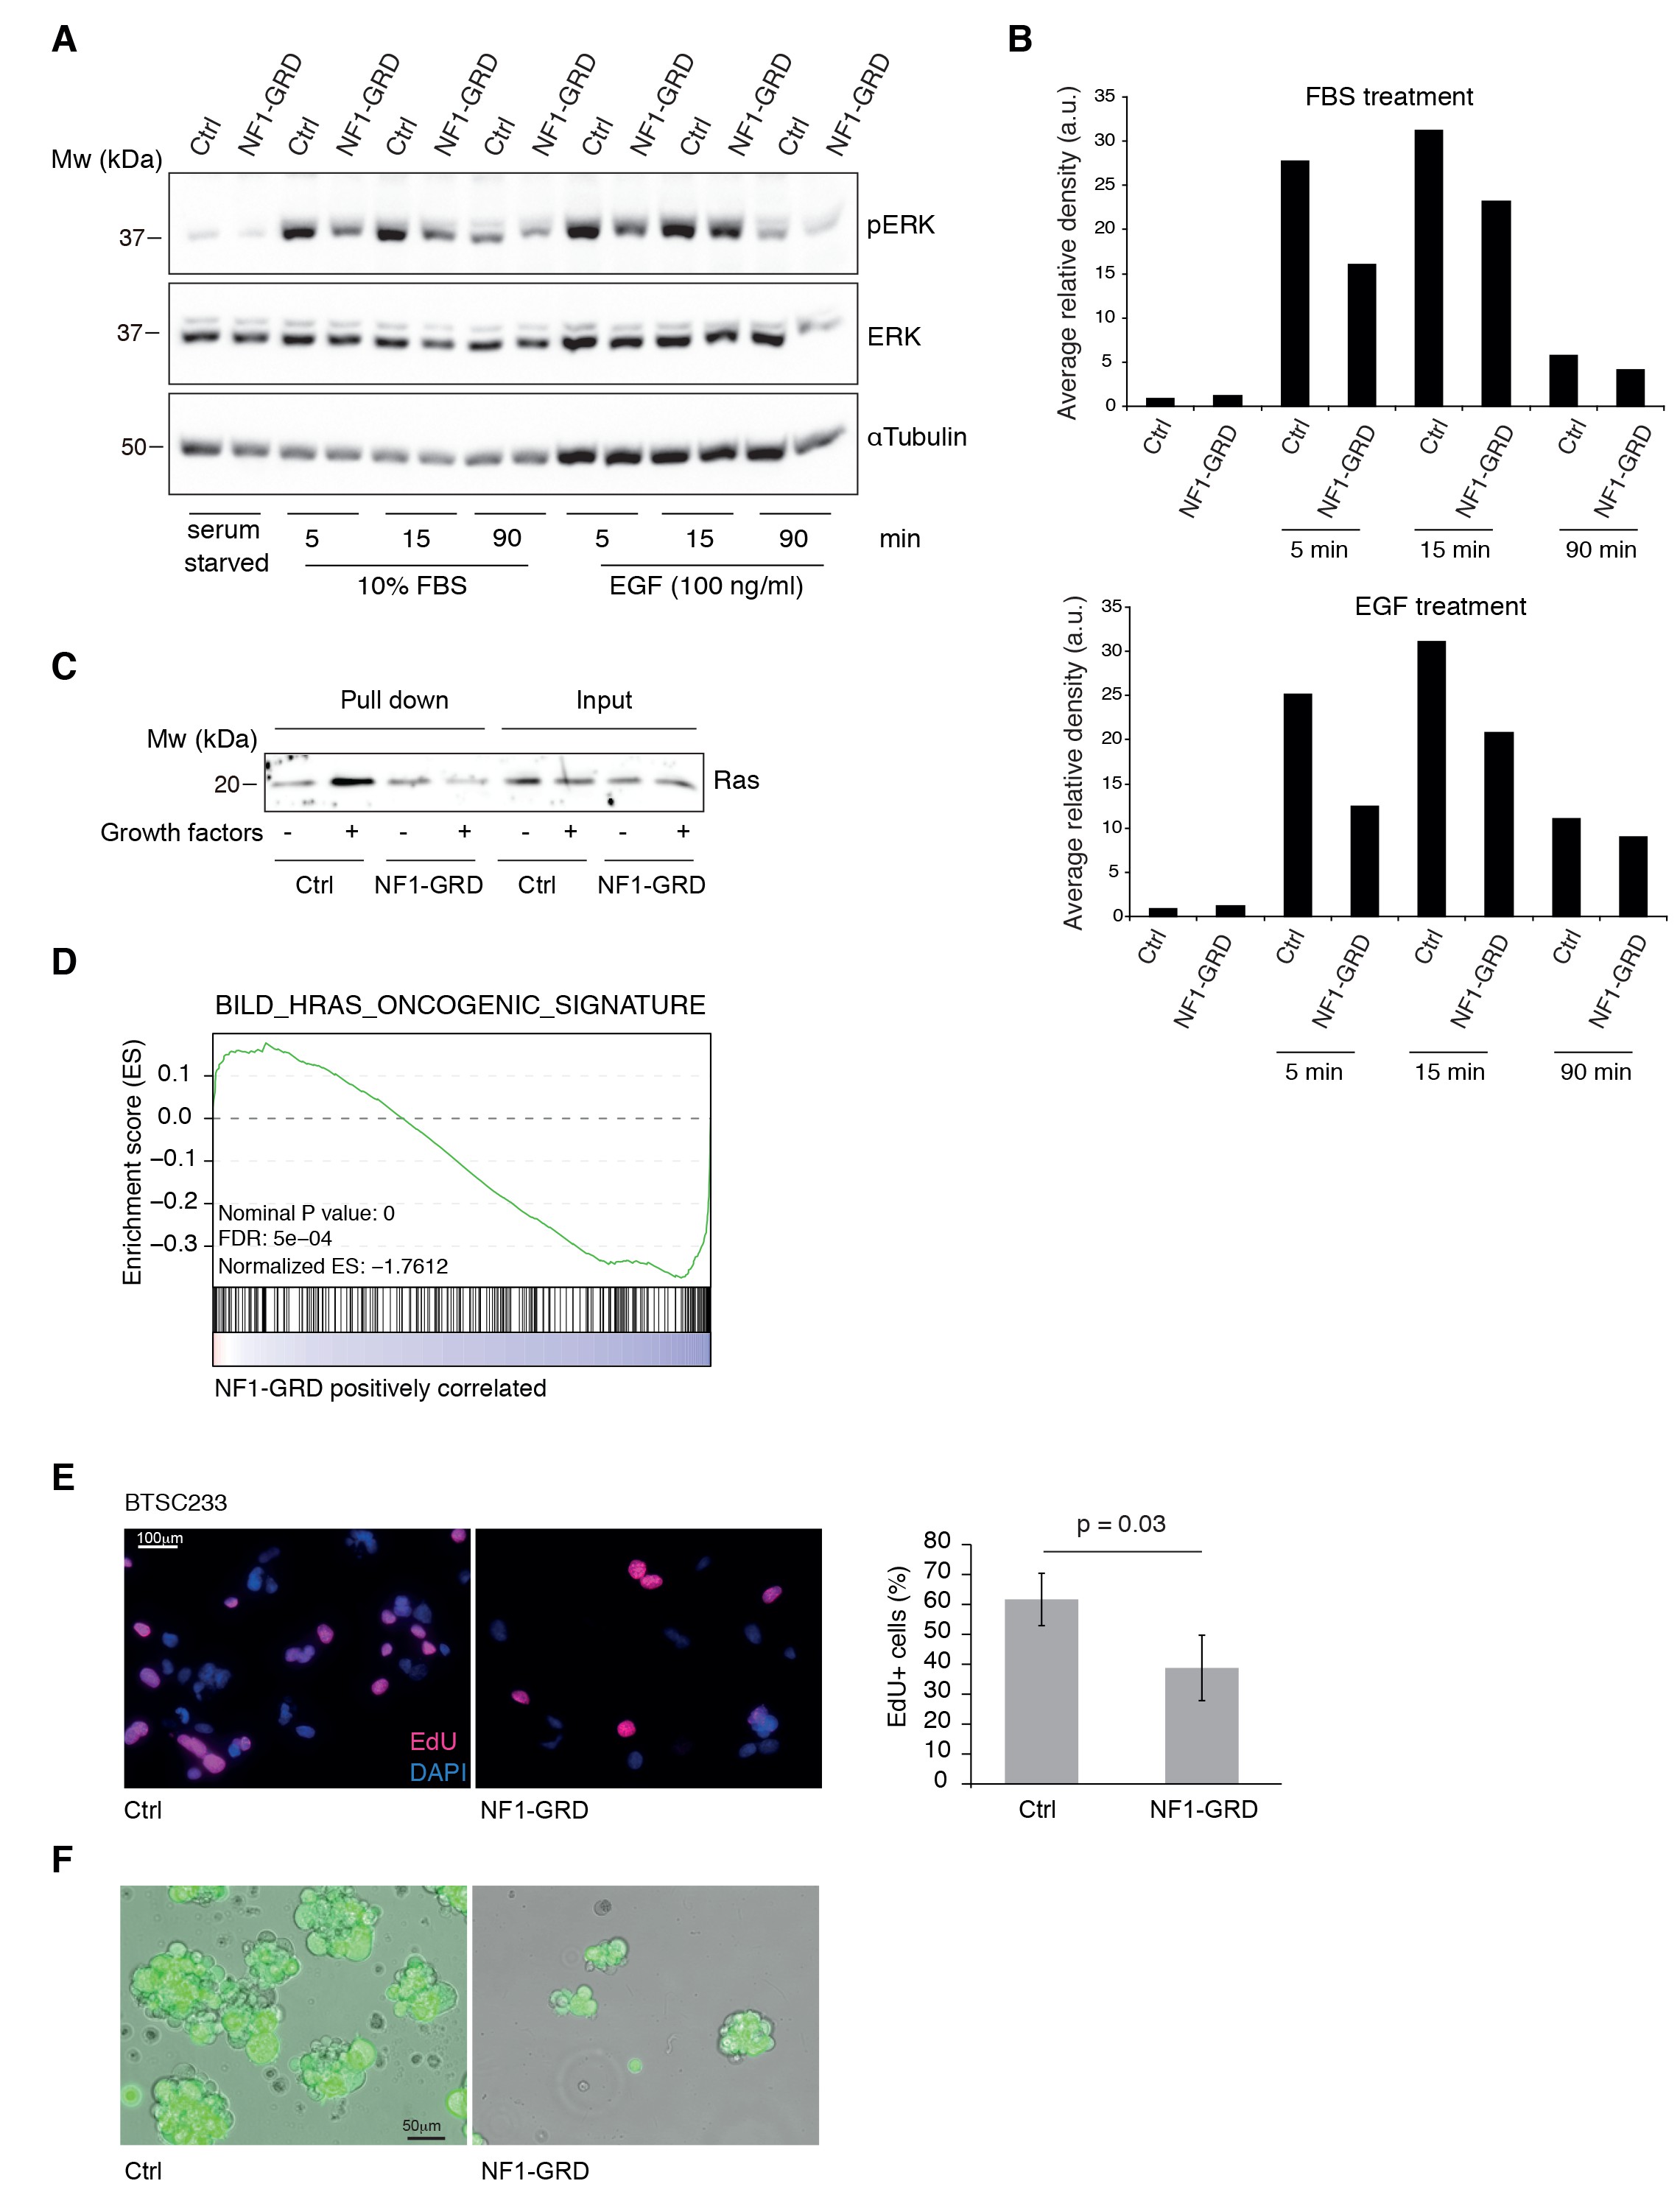
NF1-GRD expression leads to downregulation of RAS signaling.
(A) Western blot analysis of ERK and pERK expression in BTSC 233 cells transduced with NF1-GRD expressing lentivirus and stimulated with 10% FBS or 100 ng/ml EGF. α-Tubulin is included as loading control. (B) Densitometric analysis of western blot in (A). (C) Western blot analysis of active Ras pull-down assay in BTSC 233 expressing NF1-GRD or control in the presence or absence of growth factors. (D) Gene set enrichment analysis (GSEA) of Ras-induced oncogenic signature in BTSC 233 cells transduced with NF1-GRD expressing lentivirus versus Ctrl. (E) EdU staining of BTSC 233 cell line upon NF1-GRD overexpression, counterstained with DAPI. Quantification of the fluorescence intensity of EdU staining is shown in the right panel. Ctrl, n = 4; NF1-GRD, n = 4. (F) Micrographs showing representative BTSC 233 Ctrl and NF1-GRD grown for 2 weeks after cell transduction.
figure_S4b <- as.ggplot(~ replotGSEA(path = "Data/GSEA/Freiburg_BTSC233_NF1_GRD.Gsea.1612877445786",
                                     gene.set = "FOSL1_REGULON",
                                     class.name = "NF1-GRD positively correlated"))

figure_S4b
Gene set enrichment analysis (GSEA) of FOSL1 targets signature in BTSC 233 cells transduced with NF1-GRD or Ctrl vector.
figure_S4c_left <-  qPCR_data %>%
  filter(Cells == "BTSC 233") %>%
  plot_normqPCR(panel = "S4C",
                ref_group = "Ctrl",
                pvalue = T,
                facet_by = "Cells",
                palette = black_red,
                ylim = c(0,1.75),
                pvalues_y = 1.6)

figure_S4c_right <- qPCR_data %>%
  filter(Cells == "BTSC 232") %>%
  plot_normqPCR(panel = "S4C",
                ref_group = "Ctrl",
                pvalue = T,
                facet_by = "Cells",
                ylab = FALSE,
                palette = black_red,
                ylim = c(0,1.75),
                remove_y = T,
                pvalues_y = 1.6)

figure_S4c <- ggarrange(figure_S4c_left,
                        figure_S4c_right,
                        ncol = 2,
                        common.legend = T,
                        widths = c(2.25,2),
                        legend = "right")

figure_S4c
qRT-PCR analysis of mesenchymal FOSL1 targets (ITGA3, ITGA5, PLAU, SERPINE1, and TNC) in BTSC 233 and 232 cells transduced with NF1-GRD expressing lentivirus.
Data are normalized to 18S rRNA expression.
figure_S4f <- as.ggplot(~ replotGSEA(path = "Data/GSEA/Freiburg_BTSC3021_NF1_shNF1.Gsea.1612877131389",
                                     gene.set = "FOSL1_REGULON",
                                     class.name = "shNF1 positively correlated"))
figure_S4f
GSEA of FOSL1 targets signature in BTSC 3021 cells transduced with shNF1 or shCtrl.
figure_S4g_left <-  qPCR_data %>%
filter(Cells == "BTSC 3021") %>%
  plot_normqPCR(panel = "S4G",
                ref_group = "shCtrl",
                pvalue = F,
                facet_by = "Cells",
                legend = "right",
                palette = brewer.pal(4,"Set1")[c(1,2,4)],
                ylim = c(0,3),
                pvalues_y = 2.75)

figure_S4g_right <-  qPCR_data %>%
filter(Cells == "BTSC 3047") %>%
  plot_normqPCR(panel = "S4G",
                ref_group = "shCtrl",
                pvalue = F,
                facet_by = "Cells",
                ylab = FALSE,
                legend = "right",
                palette = brewer.pal(4,"Set1")[c(1,3,4)],
                ylim = c(0,3),
                remove_y = T,
                pvalues_y = 2.75)

figure_S4g <- ggarrange(figure_S4g_left,
                        figure_S4g_right,
                        ncol = 2,
                        common.legend = T,
                        widths = c(2.25,2),
                        legend = "right")

figure_S4g
qRT-PCR analysis of mesenchymal FOSL1 targets BTSC 3021 and 3047 cells transduced with shNF1 expressing lentiviruses.
Data are normalized to 18S rRNA expression.
figure_S4h <- qPCR_data %>%
  plot_normqPCR(panel = "S4H",
                ref_group = "Ctrl",
                pvalue = T,
                facet_by = "Cells",
                legend = "right",
                palette = black_red,
                ylim = c(0,1.75),
                pvalues_y = 1.6)

figure_S4h
qRT-PCR analysis of MES genes master regulators expression (BHLHB2, CEBPB, FOSL2, RUNX1, STAT3, and TAZ) upon NF1-GRD overexpression in BTSC 233.
figure_S4i <- qPCR_data %>%
  plot_normqPCR(panel = "S4I",
                ref_group = "shCtrl",
                pvalue = T,
                facet_by = "Cells",
                legend = "right",
                palette = "Set1",
                pvalues_y = 5.5,
                ylim = c(0,6))

figure_S4i
qRT-PCR analysis of MES genes master regulators expression (BHLHB2, CEBPB, FOSL2, RUNX1, STAT3, and TAZ) upon NF1 knockdown in BTSC 3021 cells.
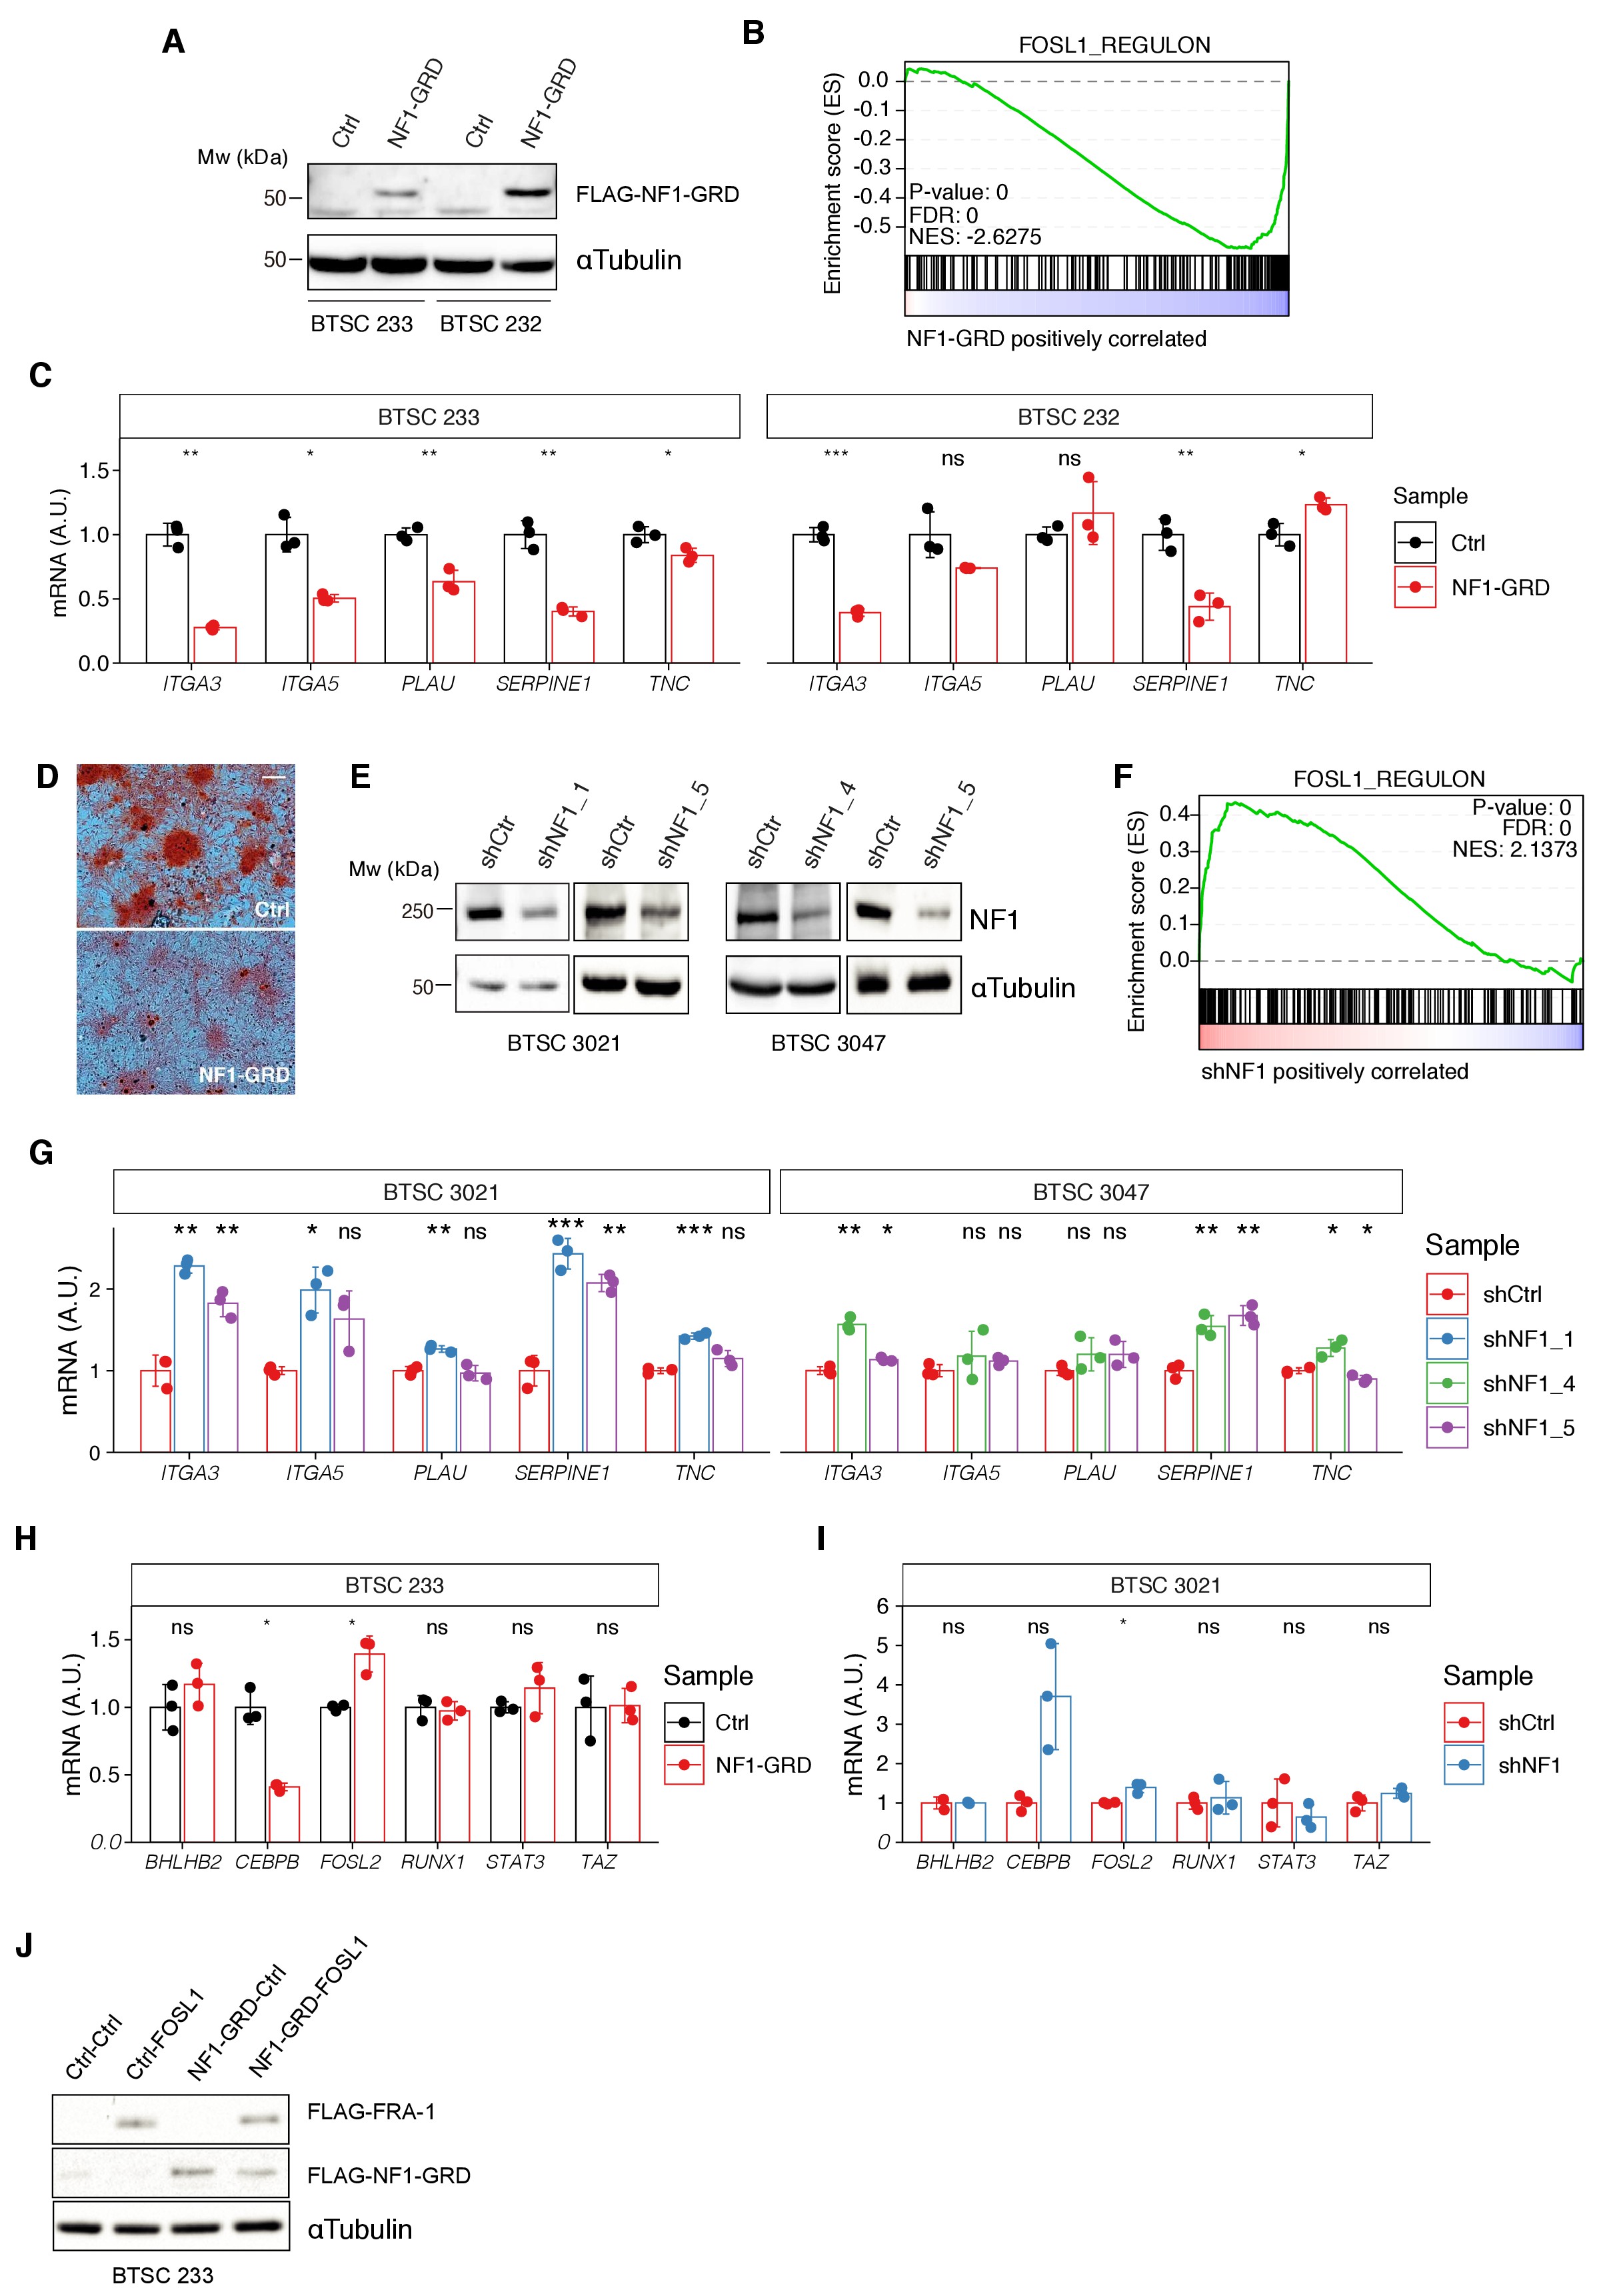
Modulation of NF1 expression regulates FOSL1 targets and mesenchymal genes.
(A) Western blot analysis of FLAG-NF1-GRD expression in mesenchymal (MES) cells (BTSC 233 and 232). (B) Gene set enrichment analysis (GSEA) of FOSL1 targets signature in BTSC 233 cells transduced with NF1-GRD or Ctrl vector. (C) qRT-PCR analysis of mesenchymal FOSL1 targets (ITGA3, ITGA5, PLAU, SERPINE1, and TNC) in BTSC 233 and 232 cells transduced with NF1-GRD expressing lentivirus. Data are normalized to 18S rRNA expression. (D) Osteogenesis differentiation assay of BTSC 233 transduced as indicated above. Alzarin Red staining indicates osteogenesis differentiation. Scale bar represents 200 µm. (E) Western blot analysis of NF1 expression upon NF1 knockdown in non-MES cells (BTSC 3021 and 3047). (F) GSEA of FOSL1 targets signature in BTSC 3021 cells transduced with shNF1 or shCtrl. (G) qRT-PCR analysis of mesenchymal FOSL1 targets BTSC 3021 and 3047 cells transduced with shNF1 expressing lentiviruses. Data are normalized to 18S rRNA expression. (H, I) qRT-PCR analysis of MES genes master regulators expression (BHLHB2, CEBPB, FOSL2, RUNX1, STAT3, and TAZ) upon NF1-GRD overexpression in BTSC 233 (H) or NF1 knockdown in BTSC 3021 cells (I). Data are normalized to GAPDH or 18S rRNA expression, respectively. (J) Western blot analysis of FLAG-NF1-GRD and FLAG-FRA-1 expression in BTSC 233 cells. qRT-PCR data in (C), (G), (H), and (I) are presented as mean ± SD (n = 3, technical replicates); Student’s t test, ns = not-significant, *p≤0.05, **p≤0.01, ***p≤0.001.
figure_S5b_left <- qPCR_data %>%
  filter(Cells == "BTSC 3021") %>%
  plotqPCR(panel = "S5B",
           normalizer = "18s",
           ref_group = "shCtrl_DMSO",
           levels = c("shCtrl_DMSO","shCtrl_GDC-0623",
                      "shNF1_5_DMSO","shNF1_5_GDC-0623"),
           pvalue = F,
           legend = "right",
           palette = "Set1",
           ylim = c(0,5),
           title = "BTSC 3021")

figure_S5b_right <- qPCR_data %>%
  filter(Cells == "BTSC 3047") %>%
  plotqPCR(panel = "S5B",
           normalizer = "18s",
           ref_group = "shCtrl_DMSO",
           levels = c("shCtrl_DMSO","shCtrl_GDC-0623",
                      "shNF1_5_DMSO","shNF1_5_GDC-0623"),
           pvalue = F,
           legend = "right",
           palette = "Set1",
           ylim = c(0,3),
           title = "BTSC 3047")

figure_S5b <- ggarrange(figure_S5b_left,
                        figure_S5b_right,
                        common.legend = T,
                        ncol = 1)

figure_S5b
qRT-PCR analysis of FOSL1 and the MES genes ITGA3 and SERPINE1 in samples treated as in (A).
Data are presented as mean ± SD (n = 3), normalized to 18S rRNA expression; Student’s t test of DMSO vs. GDC-0623 (either shCtrl or shNF1_5), **p≤0.01, ***p≤0.001, ns = not significant.
figure_S5f <- gsea_report_all_analysis %>%
  filter(Analysis == "NSCs_shNF1_sgFosl1") %>%
  ggplot(aes(x = reorder(NAME,NES), y = NES)) +
  geom_col(aes(fill = TYPE, color =`FDR.q.val`< 0.1), width = 0.75) +
  coord_flip() + xlab("") +
  theme_cowplot() + theme(axis.text.y=element_text(size = 7)) +
  scale_fill_manual(values = c("#F5AE26", "#EA549D")) +
  scale_color_manual(values = c("gray","black"))

figure_S5f
Gene set enrichment analysis (GSEA) results of p53-null shNf1 NSCs sgFosl1_1 and sgFosl1_3 versus sgCtrl neural stem cells (NSCs); n = 3 for each group.
figure_S5g_left <- qPCR_data %>%
  plotqPCR(panel = "S5G_left", normalizer = "Gapdh",
           ref_group = "sgCtrl",
           levels = c("sgCtrl","sgFosl1_1","sgFosl1_3"),
           pvalue = F,
           ylim = c(0,1.5),
           legend = "right",
           palette = black_red_green,
           title = "MES genes")

figure_S5g_right <- qPCR_data %>%
  plotqPCR(panel = "S5G_right", normalizer = "Gapdh",
           ref_group = "sgCtrl",
           levels = c("sgCtrl","sgFosl1_1","sgFosl1_3"),
           pvalue = F,
           ylim = c(0,4),
           legend = "right",
           palette = black_red_green,
           title = "PN genes")

figure_S5g <- ggarrange(figure_S5g_left,
                        figure_S5g_right,
                        common.legend = T,
                        legend = "right",
                        nrow = 1,widths = c(1.5,1))

figure_S5g
mRNA expression of MES (left panel) and PN genes (right panel) in sgCtrl and sgFosl1 in p53-null shNf1 NSCs.
Data from a representative of two experiments are presented as mean ± SD (n = 3, technical replicates), normalized to Gapdh expression.
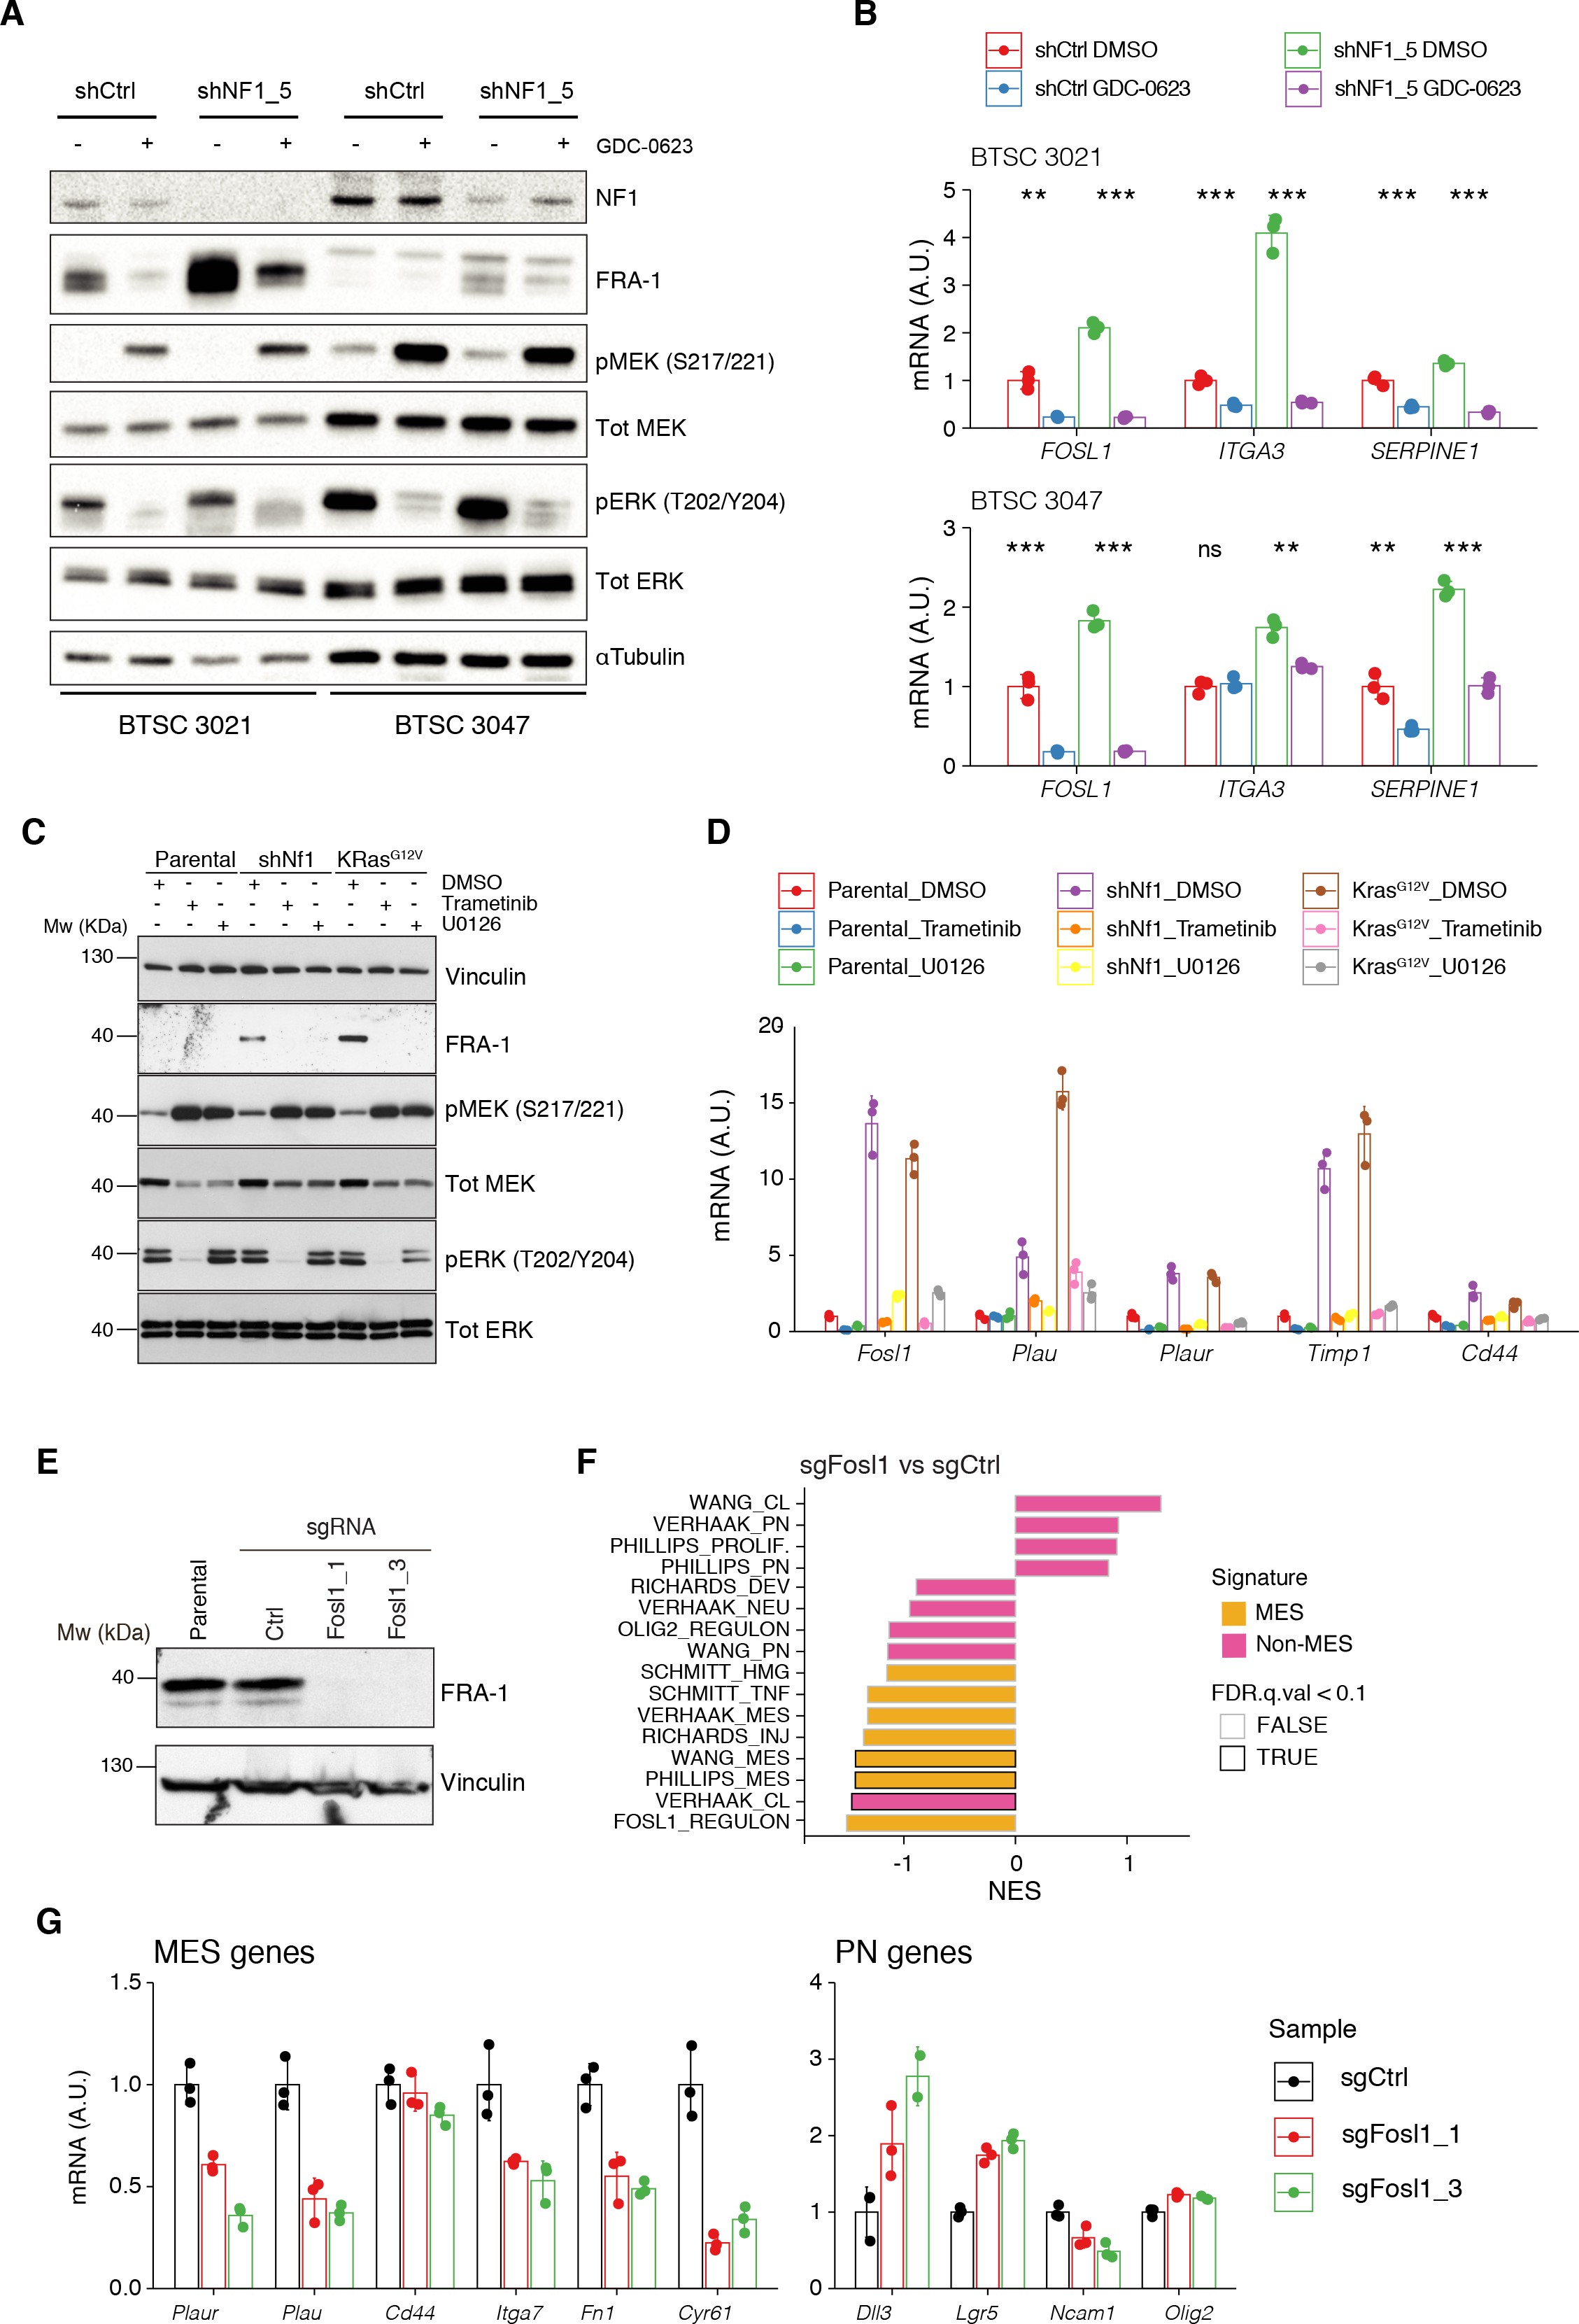
MAPK inhibition reverts the effects of NF1 silencing on FOSL1 and mesenchymal genes expression.
(A) Western blot analysis of non-mesenchymal (non-MES) cells (BTSC 3021 and 3047) transduced with shCtrl or shNF15 and treated with the MEK inhibitor GDC-0623 (1 μM for 16 hr); α-tubulin was used as loading control. (B) qRT-PCR analysis of _FOSL1 and the MES genes ITGA3 and SERPINE1 in samples treated as in (A). Data are presented as mean ± SD (n = 3), normalized to 18S rRNA expression; Student’s t test of DMSO vs. GDC-0623 (either shCtrl or shNF15), **p≤0.01, ***p≤0.001, ns = not significant. (C) Western blot analysis using the specified antibodies of p53-null NSCs, parental and infected with sh_Nf1 or KrasG12V and treated for 16 hr with the MAPK inhibitors trametinib (200 nM) or U0126 (10 μM); vinculin was used as loading control. (D) qRT-PCR analysis of Fosl1 and the MES genes (Plau, Plaur, Timp1, and Cd44), in samples treated as in (C). Data are presented as mean ± SD (n = 3, technical replicates), normalized to Actin expression. (E) FRA-1 expression detected by western blot in p53-null shNf1 NSCs upon transduction with sgRNAs targeting Fosl1; vinculin was used as loading control. (F) Gene set enrichment analysis (GSEA) results of p53-null shNf1 NSCs sgFosl11 and sgFosl1_3 versus sgCtrl neural stem cells (NSCs); n = 3 for each group. (G) mRNA expression of MES (_left panel) and PN genes (right panel) in sgCtrl and sgFosl1 in p53-null shNf1 NSCs. Data from a representative of two experiments are presented as mean ± SD (n = 3, technical replicates), normalized to Gapdh expression.
To test whether a NF1-MAPK signaling is involved in the regulation of FOSL1 and the MES subtype, we manipulated NF1 expression in patient-derived GBM tumorspheres of either MES or non-MES subtypes. To recapitulate the activity of the full-length NF1 protein, we transduced the cells with the NF1 GTPase-activating domain (NF1-GRD), spanning the whole predicted Ras GTPase-activating (GAP) domain 58McCormick1990. NF1-GRD expression in the MES cell line BTSC 233 led to (i) inhibition of RAS activity as confirmed by analysis of pERK expression upon EGF or serum stimulation (Figure 2—figure supplement 1A, B) as well as by RAS pull-down assay (Figure 2—figure supplement 1C); (ii) strong reduction of a RAS-induced oncogenic signature expression (NES = −1.7; FDR q-value < 0.001) (Figure 2—figure supplement 1D); and (iii) diminished cell proliferation (Figure 2—figure supplement 1E, F). Consistent with the negative correlation of FOSL1 and NF1 mRNA levels in IDH-wt gliomas (Figure 2D), NF1-GRD overexpression in two independent MES GBM lines (BTSC 233 and BTSC 232) was associated with a significative downregulation of FOSL1 and FOSL1-regulated genes (Figure 2E and Figure 2—figure supplement 2A–C). Concurrently, we also observed a significant decrease of two well-characterized mesenchymal features, namely CHI3L1 expression (Figure 2F) as well as the ability of MES GBM cells to differentiate into osteocytes, a feature shared with mesenchymal stem cells (66Ricci-Vitiani et al.2008; 79Tso et al.2006; Figure 2—figure supplement 2D). Moreover, NF1-GRD expression led to a significant reduction of the FOSL1 regulon and the MGSs, with a concurrent increase of the OLIG2 regulon and the non-MES gene signatures (non-MGSs) (Figure 2G).
Conversely, NF1 knockdown with three independent shRNAs (shNF11, shNF1_4, and shNF1_5) in two non-MES lines (BTSC 3021 and BTSC 3047) (Figure 2—figure supplement 2E) led to an upregulation of _FOSL1 (Figure 2H), with a concomitant significant increase in its targets (Figure 2—figure supplement 2F, G), an upregulation of the MGSs, and downregulation of the N-MGSs (Figure 2I).
The observed NF1-mediated gene expression changes might be potentially driven by an effect on FOSL1 or other previously described mesenchymal TFs (such as BHLHB2, CEBPB, FOSL2, RUNX1, STAT3, and TAZ;) 9Bhat et al.201115Carro et al.2010. Interestingly, only FOSL1, and to some extent CEBPB, was consistently downregulated upon NF1-GRD expression (Figure 2—figure supplement 2H) and upregulated following NF1 knockdown (Figure 2—figure supplement 2I). To then test whether FOSL1 was playing a direct role in the NF1-mediated regulation of mesenchymal genes expression, we overexpressed FOSL1 in the MES GBM lines transduced with the NF1-GRD (Figure 2—figure supplement 2J). qRT-PCR analysis showed that FOSL1 was able to rescue the NF1-GRD-mediated downregulation of mesenchymal genes, such as ITGA3, ITGA5, SERPINE1, and TNC (Figure 3J). Lastly, exposure of NF1 silenced cells to the MEK inhibitor GDC-0623, led to a reduction of FOSL1 upregulation, both at the protein and the mRNA levels, as well as to a downregulation of the mesenchymal genes ITGA3 and SERPINE1 (Figure 2—figure supplement 3A, B).
figure_3b <- qPCR_data %>%
  plotqPCR(panel = "3B",
           normalizer = "Gapdh",
           ref_group = "Parental",
           levels = c("Parental","shNf1","sgNf1","KrasG12V"),
           pvalue = T,
           legend = "top",
           palette = "Set1",
           ylim = c(0,8))

figure_3b
mRNA expression of Fosl1 and MES genes (Plau, Plaur, Timp1, and Cd44) in infected p53-null NSCs compared to parental cells (not infected).
Data from a representative of two experiments are presented as mean ± SD (n = 3), normalized to Gapdh expression. Student’s t test, relative to parental cells: ns = not significant, *p≤0.05, **p≤0.01, ***p≤0.001.
figure_3d <- gsea_report_all_analysis %>%
  filter(Analysis == "NSCs_Kras_sgFosl1") %>%
  ggplot(aes(x = reorder(NAME,NES), y = NES)) +
  geom_col(aes(fill = TYPE, color =`FDR.q.val`<0.05), width = 0.75) +
  coord_flip() + xlab("") +
  theme_cowplot() + theme(axis.text.y=element_text(size = 7)) +
  scale_fill_manual(values = c("#F5AE26", "#EA549D")) +
  scale_color_manual(values = c("gray","black"))

figure_3d
Gene set enrichment analysis (GSEA) results of p53-null KrasG12V sgFosl1_1 versus sgCtrl NSCs.
figure_3e <-  qPCR_data %>%
  plotqPCR(panel = "3E",
           normalizer = "Gapdh",
           ref_group = "sgCtrl",
           levels = c("sgCtrl","sgFosl1"),
           pvalue = T,
           legend = "none",
           palette = black_red,
           ylim = c(0,1.5),
           title = "MES genes")

figure_3e
mRNA expression of MES in sgCtrl and sgFosl1_1 p53-null KrasG12V NSCs.
Data from a representative of two experiments are presented as mean ± SD (n = 3, technical replicates), normalized to Gapdh expression. Student’s t test, relative to sgCtrl: *p≤0.05; **p≤0.01; ***p≤0.001.
figure_3f <- qPCR_data %>%
  filter(Gene != "Dll3") %>%
  plotqPCR(panel = "3F",
           normalizer = "Gapdh",
           ref_group = "sgCtrl",
           levels = c("sgCtrl","sgFosl1"),
           pvalue = T,
           legend = "right",
           palette = black_red, ylim = c(0,10),
           title = "PN genes")

figure_3f
mRNA expression of PN genes in sgCtrl and sgFosl1_1 p53-null KrasG12V NSCs.
Data from a representative of two experiments are presented as mean ± SD (n = 3, technical replicates), normalized to Gapdh expression. Student’s t test, relative to sgCtrl: *p≤0.05; **p≤0.01; ***p≤0.001.
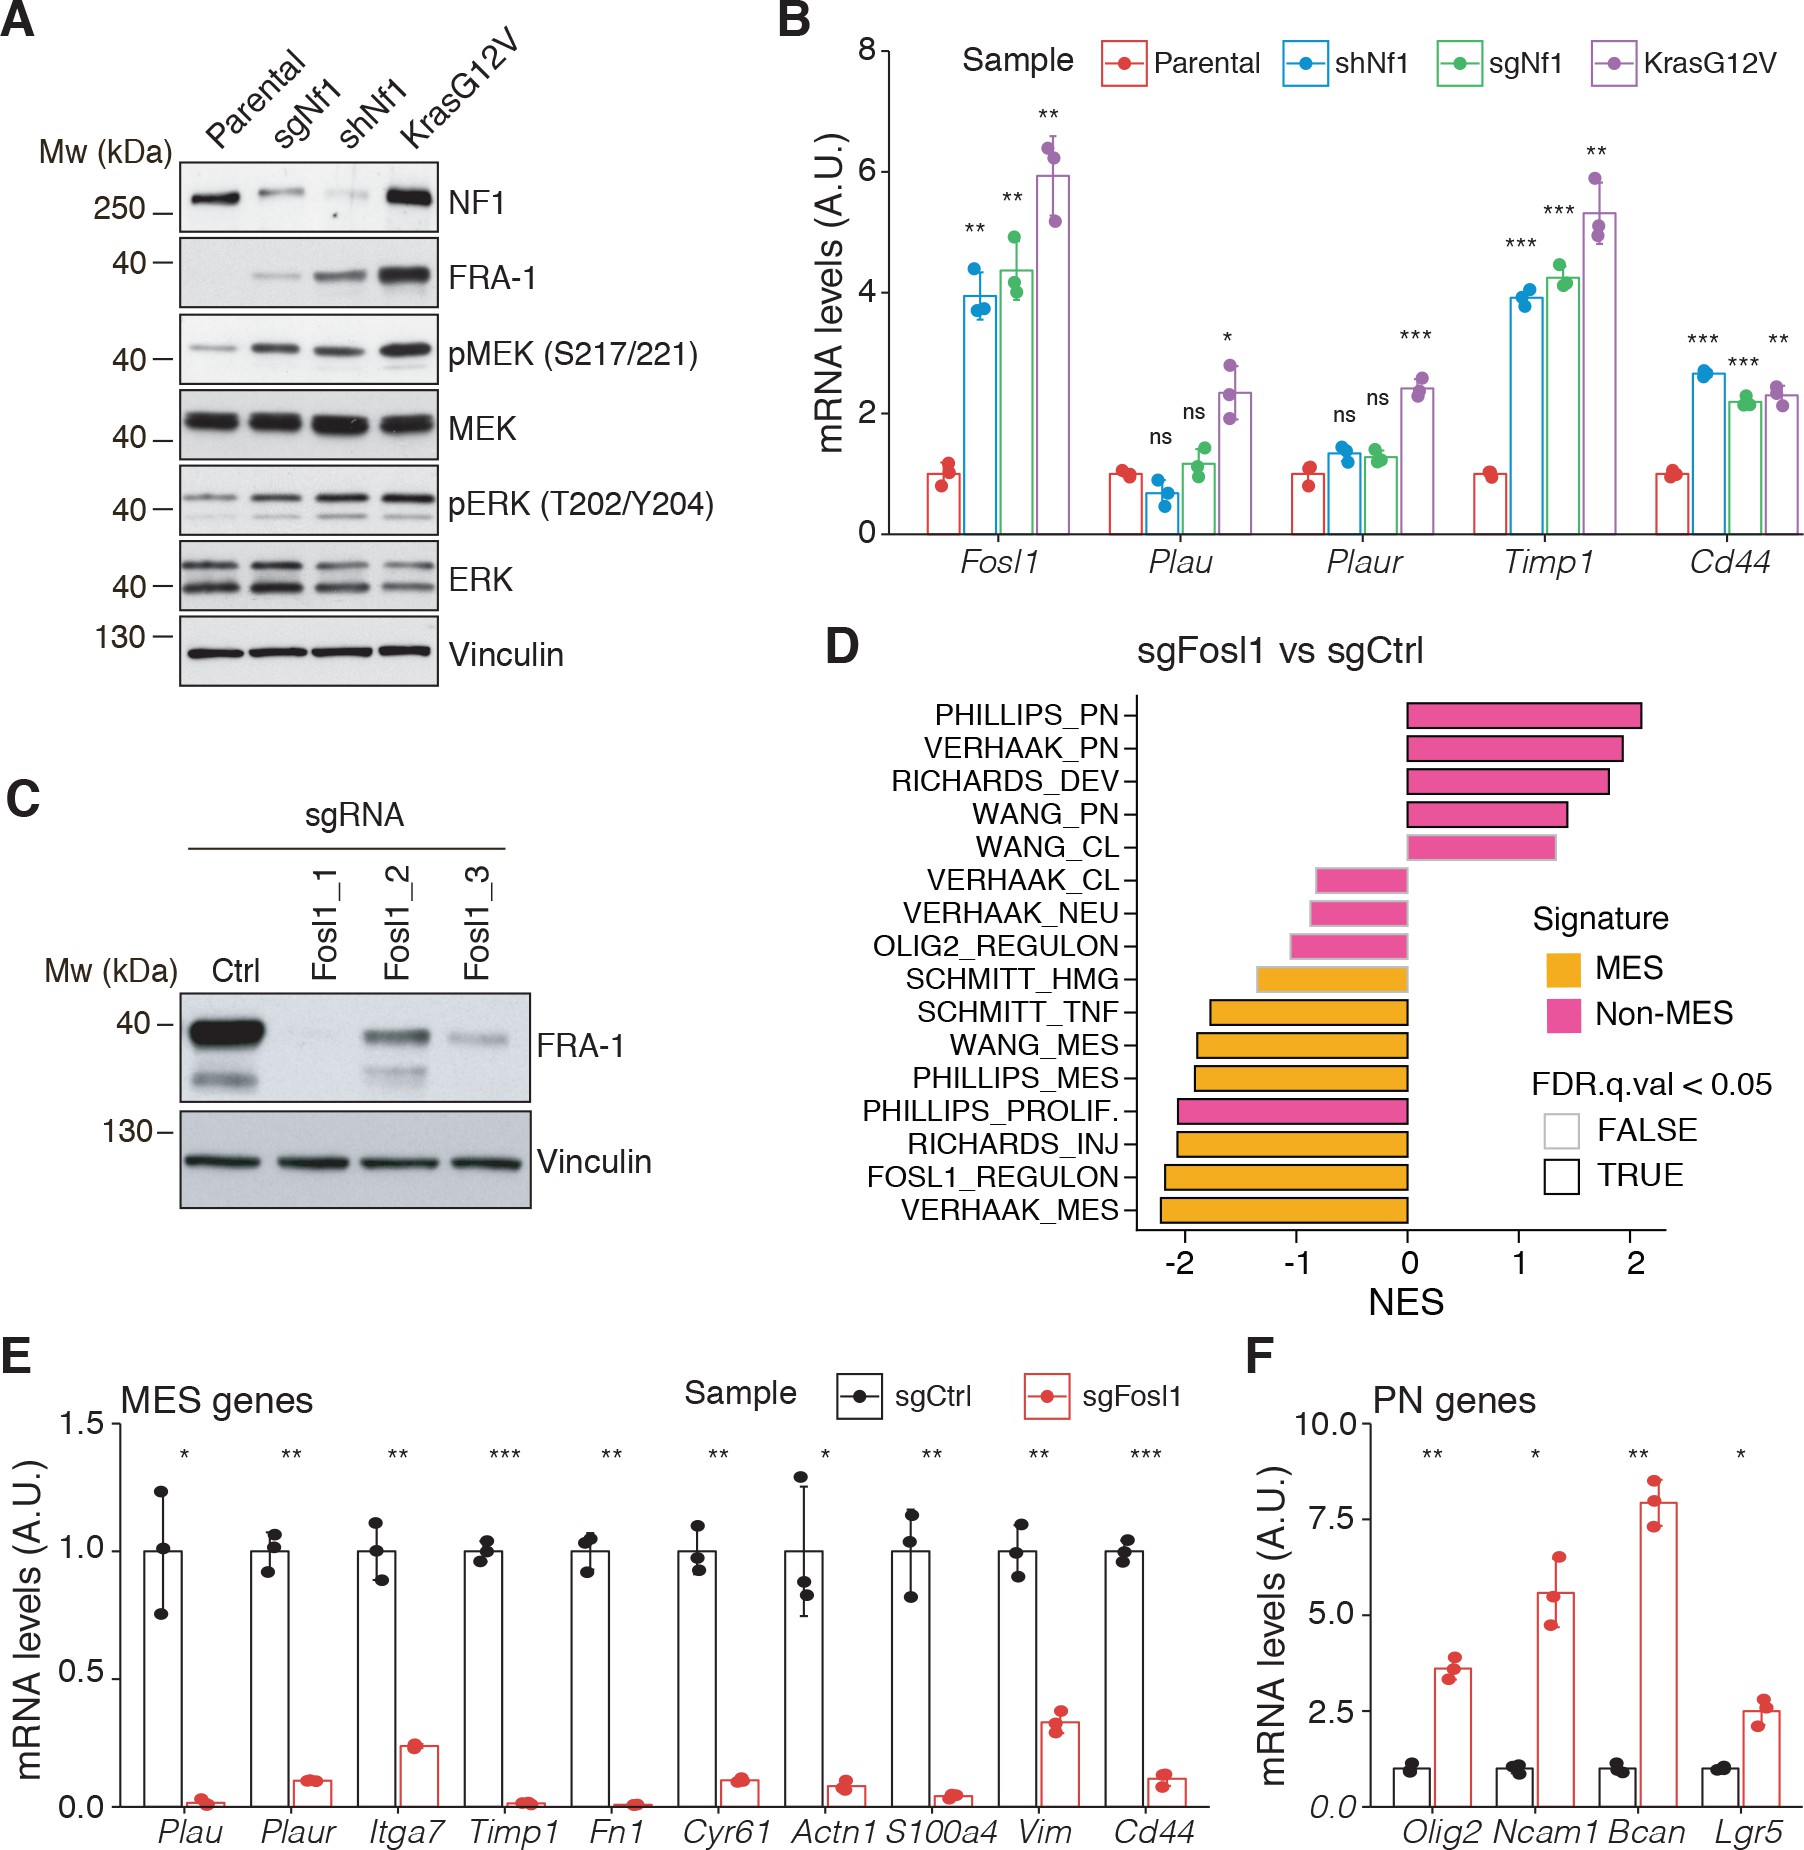
Fosl1 is induced by MAPK kinase activation and is required for mesenchymal (MES) gene expression.
(A) Western blot analysis using the specified antibodies of p53-null neural stem cells (NSCs), parental and infected with sgNf1, shNf1, and KrasG12V; vinculin was used as loading control. (B) mRNA expression of Fosl1 and MES genes (Plau, Plaur, Timp1, and Cd44) in infected p53-null NSCs compared to parental cells (not infected). Data from a representative of two experiments are presented as mean ± SD (n = 3), normalized to Gapdh expression. Student’s t test, relative to parental cells: ns = not significant, *p≤0.05, **p≤0.01, ***p≤0.001. (C) FRA-1 expression detected by western blot in p53-null KrasG12V NSCs upon transduction with sgRNAs targeting Fosl1, after selection with 1 µg/mL puromycin; vinculin was used as loading control. (D) Gene set enrichment analysis (GSEA) results of p53-null KrasG12V sgFosl1_1 versus sgCtrl NSCs. (E, F) mRNA expression of MES (E) and PN genes (F) in sgCtrl and sgFosl1_1 p53-null KrasG12V NSCs. Data from a representative of two experiments are presented as mean ± SD (n = 3, technical replicates), normalized to Gapdh expression. Student’s t test, relative to sgCtrl: *p≤0.05; **p≤0.01; ***p≤0.001.
Overall these evidences implicate the NF1-MAPK signaling in the regulation of the MGSs through the modulation of FOSL1 expression.
Fosl1 deletion induces a shift from a MES to a PN gene signature
To further explore the NF1-MAPK-FOSL1 axis in MES GBM, we used a combination of the RCAS-Tva system with the CRISPR/Cas9 technology, recently developed in our laboratory 61Oldrini et al.2018, to induce Nf1 loss or Kras mutation. Mouse NSCs from hGFAP-Tva; hGFAP-Cre; Trp53lox; ROSA26-LSL-Cas9 pups were isolated and infected with viruses produced by DF1 packaging cells transduced with RCAS vectors targeting the expression of Nf1 through shRNA and sgRNA (shNf1 and sgNf1) or overexpressing a mutant form of Kras (KrasG12V). Loss of NF1 expression was confirmed by western blot, and FRA-1 was upregulated in the two models of Nf1 loss compared to parental cells and further upregulated in cells infected with KrasG12V (Figure 3A). Consistent with activation of the Ras signaling, as a result of both Nf1 loss and Kras mutation, the MEK/ERK pathway was more active in infected cells compared to parental cells (Figure 3A). Higher levels of activation of the MEK/ERK pathway were more pronounced in the Kras mutant cells and were associated with a stronger induction of mesenchymal genes such as Plau, Plaur, Timp1, and Cd44 (Figure 3B). Moreover, the upregulation of both FRA-1 and the mesenchymal genes was blocked by exposing shNf1 and Kras mutant cells to the MAPK inhibitors trametinib or U0126 (Figure 2—figure supplement 3C, D).
Taking advantage of the Cas9 expression in the generated p53-null NSCs models, Fosl1 was knocked out through sgRNAs. Efficient downregulation of FRA-1 was achieved with two different sgRNAs (Figure 3C and Figure 2—figure supplement 3E). Cells transduced with sgFosl1_1 and sgFosl1_3 were then subjected to further studies.
As suggested by the data presented here on the human BTSCs datasets and cell lines, FOSL1 appears to be a key regulator of the MES subtype. Consistently, RNA-seq analysis followed by GSEA of p53-null KrasG12V sgFosl1_1 versus sgCtrl revealed a significant loss of the MGSs and increase in the N-MGSs (Figure 3D). These findings were validated by qRT-PCR with a significant decrease in expression of a panel of MES genes (Plau, Itga7, Timp1, Plaur, Fn1, Cyr61, Actn1, S100a4, Vim, Cd44) (Figure 3E) and increased expression of PN genes (Olig2, Ncam1, Bcan, Lgr5) in the Fosl1 knock-out (KO) KrasG12V NSCs (Figure 3F). A similar trend was observed in the Fosl1 KO shNf1 NSCs (Figure 2—figure supplement 3F, G), and the extent of MSG regulation appeared proportional to the extent of MAPK activation by individual perturbations (Figure 3A).
Altogether, these data indicated that KrasG12V–transduced cells, which show the highest FOSL1 expression and mesenchymal commitment, are a suitable model to functionally study the role of a MAPK-FOSL1 axis in MES GBM.
Fosl1 depletion affects the chromatin accessibility of the mesenchymal transcription program and differentiation genes
FOSL1 is a member of the AP-1 TF super family, which may be composed of a diverse set of homo- and heterodimers of the individual members of the JUN, FOS, ATF, and MAF protein families. In GBM, AP-1 can act as a pioneer factor for other transcriptional regulators, such as ATF3, to coordinate response to stress in GSCs 34Gargiulo et al.2013. To test the effect of Fosl1 ablation on chromatin regulation, we performed open chromatin profiling using ATAC-seq in the p53-null KrasG12V NSCs model (Figure 3C). This analysis revealed that Fosl1 loss strongly affects chromatin accessibility of known cis-regulatory elements such as transcription start sites (TSS) and CpG islands (CGI), as gauged by unsupervised clustering of Fosl1 wild-type and KO cells (Figure 4A). Consistent with a role for FOSL1/FRA-1 in maintaining chromatin accessibility at direct target genes, deletion of Fosl1 caused the selective closing of chromatin associated with the major AP-1 TFs binding sites (Figure 4B). Upon Fosl1 loss, profiling of the motifs indicated that chromatin associated with AP-1/2 TFs binding were closed and – conversely – a diverse set of general and lineage-specific TFs, including MFZ1, NRF1, RREB1, and others (Figure 4C), were opened. The genes associated with changes in chromatin accessibility upon Fosl1 loss are involved in several cell fate commitment, differentiation, and morphogenesis programs (Figure 4D, E). Next, we investigated chromatin remodeling dynamics using limma and identified 9749 regions with significant differential accessibility (absolute log2 fold-change >1, FDR < 0.05). Importantly, Fosl1 loss induced opening of chromatin associated with lineage-specific markers, along with closing of chromatin at the loci of genes, associated with mesenchymal GBM identity in human tumors and BTSC lines (Figure 4F–H). Taken all together, this evidence further indicates that FOSL1/FRA-1 might modulate the mesenchymal transcriptional program by regulating the chromatin accessibility of MES genes.
ATACSeq_sample_cor <- getSampleCorrelation(Figure_4_data)
ATACSeq_cor_annotation <- as.data.frame(colData(Figure_4_data))[,c("depth", "gRNA")]
ATACSeq_cor_colors <- list(gRNA = black_red_green)
names(ATACSeq_cor_colors$gRNA) <- levels(factor(ATACSeq_cor_annotation$gRNA))

figure_4a <- pheatmap(as.dist(ATACSeq_sample_cor),
                      annotation_row = ATACSeq_cor_annotation,
                      annotation_colors = ATACSeq_cor_colors,
                      clustering_distance_rows = as.dist(1-ATACSeq_sample_cor),
                      clustering_distance_cols = as.dist(1-ATACSeq_sample_cor),
                      silent = T)

figure_4a
Correlation heatmap of the ATAC-seq samples. Clustering of the Fosl1-WT (sgCtrl, n = 4) and Fosl1-depleted (sgFosl1_1 and sgFosl1_3, n = 8) samples is based upon the bias corrected deviations in chromatin accessibility (see Materials and methods).
# Getting differential deviation between control and KO samples
difdev <- differentialDeviations(Figure_4_data, "Cell_type")

difdev_sig <- difdev[difdev$p_value_adjusted < 0.05,]
difdev_sig <- difdev_sig[order(difdev_sig$p_value_adjusted),]
difdev_sig$TFs <- gsub(".*_", "", rownames(difdev_sig))

#Plot tSNE maps based with samples clustered based on chromatin deviations
set.seed(1234)
tsne_results <- deviationsTsne(Figure_4_data, threshold = 3)
tsne_plots <- plotDeviationsTsne2(Figure_4_data,
                                  tsne_results,
                                  annotation = head(difdev_sig$TFs,6),
                                  sample_column = "gRNA")

#plot the top 5 differentially deviating motifs between Fosl1 WT and KO cells
figure_4b <- ggarrange(tsne_plots[[1]]+ xlab(""),
          tsne_plots[[2]]+ xlab("") + ylab(""),
          tsne_plots[[3]]+ xlab("") + ylab(""),
          tsne_plots[[4]],
          tsne_plots[[5]]+ ylab(""),
          tsne_plots[[6]]+ ylab(""),
          widths = 80, heights = 80, ncol = 3, nrow = 2)

figure_4b
tSNE visualization of cellular similarity between Fosl1-depleted and control cells based on chromatin accessibility.
Samples are color-coded according to the cell type (black, red, and green for sgCtrl, sgFosl1_1, and sgFosl1_3 cells, respectively), or by directional z-scores.
# motifs with decreased accessibility upon Fosl1 KO
KO_down <- figure_4C_data[figure_4C_data$zmean_diff < 0,]
KO_down <- KO_down[order(KO_down$zmean_diff),]

# motifs with increased accessibility upon Fosl1 KO
KO_up <- figure_4C_data[figure_4C_data$zmean_diff > 0,]
KO_up <- KO_up[order(-KO_up$zmean_diff),]

figure_4c <-figure_4C_data %>%
  ggplot(aes(x = zmean_diff, y = -log10(p_value_adjusted),
             labels=TFs, color = zmean_diff)) +
  geom_point(alpha = 0.5)+
  geom_vline(xintercept = 0, colour="grey", linetype="dashed") +
  geom_point(size = 1) +
  scale_color_gradient2(name = "",
                        mid = "lightgray",
                        low = "blue",
                        high = "red") +
  ylim(0,8) + xlim(-19,19) +
  ggtitle("Fosl1 KO vs Ctrl") +
  geom_text_repel(data          = head(KO_down,5), aes(label=TFs),
                   size          = 3,
                   box.padding   = 0.35,
                   point.padding = 0.5,
                   segment.size  = 0.2,
                   force         = 60,
                   segment.color = "grey50") +
  geom_text_repel(data         = head(KO_up,5), aes(label=TFs),
                   size          = 3,
                   box.padding   = 0.35,
                   point.padding = 0.5,
                   segment.size  = 0.2,
                   force         = 60,
                   segment.color = "grey50") +
  labs(x = "Bias corrected deviations", y = "-log10(padj)") +
  theme_pubr(margin = T) + font_size +
  theme(legend.position = c(0.8,0.8),legend.key.size = unit(0.75,"line"),
        legend.direction = "horizontal", legend.text = element_text(size = 8))

figure_4c
Volcano plot illustrating the mean difference in bias-corrected accessibility deviations between Fosl1-deficient and control cells against the FDR-corrected p-value for that difference.
The top differential motifs are highlighted in violet and red, indicating decreased and increased accessibility, respectively.
ego_down <- enrichGO(gene = as.vector(KO_down$TFs),
                     OrgDb = 'org.Hs.eg.db',
                     keyType = 'SYMBOL',
                     pvalueCutoff= 0.01,
                     maxGSSize = 500,
                     pAdjustMethod = "BH",
                     ont = "BP")

ego_up <- enrichGO(gene = as.vector(KO_up$TFs),
                   OrgDb = 'org.Hs.eg.db',
                   keyType = 'SYMBOL',
                   pvalueCutoff= 0.01,
                   maxGSSize = 500,
                   pAdjustMethod = "BH",
                   ont = "BP")

figure_4d <- emaplot(ego_down, showCategory=10,
                      pie_scale = 0.5,
                      line_scale = 0.5,
                      color = "p.adjust",
                     text_size = 25) +
  theme(text = element_text(size = 8)) +
  ggtitle("GO pathways enriched \nin Fosl1-KO closed regions")

figure_4d
Top enriched Gene Ontology (GO) biological processes pathways for the regions with decreased chromatin accessibility upon Fosl1 loss.
The nodes represent the functional categories from the respective databases, color-coded by the significance of enrichment (FDR < 0.05). The node size indicates the number of query genes represented among the ontology term, and the edges highlight the relative relationships among these categories.
figure_4e <-emaplot(ego_up, showCategory=10,
                     pie_scale=0.5,
                     line_scale = 0.5,
                     color = "p.adjust",
                     text_size = 25) +
  theme(text = element_text(size = 8)) +
  ggtitle("GO pathways enriched \nin Fosl1-KO open regions")

figure_4e
Top enriched Gene Ontology (GO) biological processes pathways for the regions with increased chromatin accessibility upon Fosl1 loss.
The nodes represent the functional categories from the respective databases, color-coded by the significance of enrichment (FDR < 0.05). The node size indicates the number of query genes represented among the ontology term, and the edges highlight the relative relationships among these categories.
seqmonk_count <- figure_4F_data

DE_probes <- data.frame(name = seqmonk_count$Feature,
                        baseMean = rowMeans(seqmonk_count[16:27]),
                        log2FoldChange = -seqmonk_count$Log2.Fold.Change..LIMMA.stats.p.1.0.after.correction.,
                        padj = seqmonk_count$FDR..LIMMA.stats.p.1.0.after.correction.,
                        stringsAsFactors = F)

DE_probes <- arrange(DE_probes,-log2FoldChange)

Wang_MES <- c(gene_signatures[["Wang_MES_2017"]])
Wang_PN <- c(gene_signatures[["Wang_PN_2017"]])
BTSC_MES <- subset(combo_eset_tT, logFC>0)$Gene.Symbol
BTSC_NonMES <- subset(combo_eset_tT, logFC<0)$Gene.Symbol

DE_probes <- DE_probes %>%
  mutate(Wang_2017 =  case_when(toupper(name) %in% Wang_MES ~ "MES",
                            toupper(name) %in% Wang_PN ~ "PN",
                            TRUE ~ "Other"),
         Wang_2017 = factor(Wang_2017,
                            levels = c("MES","PN","Other")),
         BTSCs_DE = case_when(toupper(name) %in% BTSC_MES ~ "MES",
                            toupper(name) %in% BTSC_NonMES ~ "NonMES",
                            TRUE ~ "Other"))

figure_4f <- DE_probes %>%
  ggplot(aes(x=log2FoldChange, y = Wang_2017)) +
  geom_density_ridges(aes(fill = Wang_2017),
                      alpha = 0.7,
                      scale = 1) +
  xlim(-4,4) +
  geom_vline(xintercept = c(-1,0,1),
            linetype = "dashed",
            size = 0.25) +
  scale_fill_manual(values = c("#F5AE26", "#EA549D","#4DAF4A")) +
  theme_pubr(legend = "none") + font_size +
  ggtitle("Wang_2017") +
  rremove("ylab")

figure_4f
Density plots showing the distributions of the log2 fold-changes in chromatin accessibility of the indicated probes, as measured with limma by comparing Fosl1-KO versus control cells.
figure_4g <- DE_probes %>%
  ggplot(aes(x=log2FoldChange, y = BTSCs_DE)) +
  geom_density_ridges(aes(fill = BTSCs_DE),
                      alpha = 0.7,
                      scale = 1) +
  xlim(-4,4) +
  geom_vline(xintercept = c(-1,0,1),
            linetype = "dashed",
            size = 0.25) +
  scale_fill_manual(values = c("#F5AE26", "#EA549D","#4DAF4A")) +
  theme_pubr(legend = "none") + font_size +
  ggtitle("BTSC_DE") +
  rremove("ylab")

figure_4g
Density plots showing the distributions of the log2 fold-changes in chromatin accessibility of the indicated probes, as measured with limma by comparing Fosl1-KO versus control cells.
figure_4h_left <- tracksPlot(figure_4F_data,
                             gene = "Bnc2",
                             region.min = -120000,
                             region.max = 5000)

figure_4h_right <- tracksPlot(figure_4F_data,
                              gene = "Sox11",
                              bigwig.ymax = 50)
Representative ATAC-seq tracks of two technical replicates for the MES Bnc2 and non-MES Sox11 markers loci. Tracks are color-coded as in panels (A) and (B).
Fosl1 deletion reduces stemness and tumor growth
Ras activating mutations have been widely used to study gliomagenesis, in combination with other alterations as Akt mutation, loss of Ink4a/Arf or Trp53032Friedmann-Morvinski et al.201244Holland et al.200045Koschmann et al.201659Muñoz et al.201380Uhrbom et al.2002. Thus, we then explored the possibility that Fosl1 could modulate the tumorigenic potential of the p53-null Kras mutant cells.
Cell viability was significantly decreased in Fosl1 KO cell lines as compared to sgCtrl (Figure 5A). Concomitantly, we observed a significant decreased percentage of cells in S-phase (mean values: sgCtrl = 42.6%; sgFosl1_1 = 21.6%, Student’s t test p≤0.001; sgFosl1_3 = 20.4%, Student’s t test p=0.003), an increase in percentage of cells in G2/M (mean values: sgCtrl = 11.7%, sgFosl1_1 = 28.4%, Student’s t test p≤0.001; sgFosl1_3 = 23.4%, Student’s t test p=0.012) (Figure 5B), and a reduction of the expression of cell cycle regulator genes (Ccnb1, Ccnd1, Ccne1, and Cdk1, among others) (Figure 5—figure supplement 1A).
mean_d1 <- figure_5A_data %>%
  filter(day == "d1") %>%
  group_by(Sample, day) %>%
  summarise_all(mean) %>%
  dplyr::select(-day) %>%
  dplyr::rename(d1_mean = value)

figure_5A_data <- full_join(figure_5A_data, mean_d1,"Sample") %>%
  mutate(value_norm = value/d1_mean)

figure_5a <- figure_5A_data %>%
  ggline(x = "day", y = "value_norm",
  add = c("mean_sd", "jitter"),
  ylab = "Cell growth (A.U.)",
  add.params =list(size = 0.5),
  color = "Sample",
  palette = black_red_green) +
  ylim(0,30) + font_size

# # Two-way ANOVA
# figure_5A_data %>%
#   filter(Sample != "sgFosl1_1") %>%
#   aov(value_norm ~ Sample * day, data = .) %>%
#   summary()
#
# figure_5A_data %>%
#   filter(Sample != "sgFosl1_3") %>%
#   aov(value_norm ~ Sample * day, data = .) %>%
#   summary()

figure_5a
Cell viability of control and Fosl1 KO p53-null KrasG12V neural stem cells (NSCs) measured by MTT assay; absorbance values were normalized to day 1.
Data from a representative of three independent experiments are presented as mean ± SD (n = 10, technical replicates). Two-way ANOVA, relative to sgCtrl for both sgFosl1_1 and sgFosl1_3: ***p≤0.001.
figure_5b <- figure_5B_data %>%
  ggbarplot(x = "Phase", y = "Percentage",
  add = c("mean_sd", "jitter"),
  ylab = "% cell population",
  position = position_dodge(0.8),
  color = "Sample",
  palette = black_red_green) +
  scale_y_continuous(expand = c(0, 0), limits = c(0,50))

# figure_5B_data %>%
#   compare_means(Percentage ~ Sample, ref.group = "sgCtrl", method = "t.test",
#                 symnum.args = symnum.args,data = ., group.by = "Phase")

figure_5b
Quantification of cell cycle populations of control and Fosl1 KO p53-null KrasG12V NSCs by flow cytometry analysis of PI staining.
Data from a representative of two independent experiments are presented as mean ± SD (n = 3, technical replicates). Student’s t test, relative to sgCtrl: *p≤0.05; **p≤0.01; ***p≤0.001.
elda_5C <- elda(response = figure_5C_data$Response, dose = figure_5C_data$Dose,
                tested = figure_5C_data$Tested,group = figure_5C_data$Group)

# elda_bar(elda_5C,c("Black","Red"))

figure_5c <- ggplotlimdil(elda_5C)
# elda_5C # Pvalue for the limited dilution assay

figure_5c
Representative limiting dilution experiment on p53-null KrasG12V sgCtrl and sgFosl1_1 NSCs, calculated with extreme limiting dilution assay (ELDA) analysis; bar plot inlet shows the estimated stem cell frequency with the confidence interval; chi-square p<0.0001.
QuantSeq_gset <- ExpressionSet(assayData = as.matrix(t(figure_5D_expr)),
                               phenoData=as(figure_5D_pdata,
                                            "AnnotatedDataFrame"))
col_annotation <- stem_diff_genes %>%
  dplyr::rename(Marker = Group) %>%
  filter(., !Gene_symbol %in% c("Nanog","Sall4")) %>% # filter out genes with very low expr
  mutate(Marker = as.factor(Marker)) # %>% column_to_rownames("Gene_symbol")

QuantSeq_colors <- list(Marker = brewer.pal(9, "Set1")[3:6],
                 sgRNA = c("#808080","#000000"))
names(QuantSeq_colors$Marker) <- levels(col_annotation$Marker)
names(QuantSeq_colors$sgRNA) <- levels(factor(pData(QuantSeq_gset)[,"sgRNA"]))

figure_5d <- exprs(QuantSeq_gset[featureNames(QuantSeq_gset) %in% row.names(stem_diff_genes),]) %>%
  data.frame(.) %>% # reorder based on the order of stem_diff_genes
  .[row.names(col_annotation),] %>% # reorder based on the order of stem_diff_genes
  na.omit(.) %>% # Pou5f1 (Oct4) it's not expressed
  pheatmap(.,
           annotation_col = pData(QuantSeq_gset)[,"sgRNA",drop = F],
           annotation_row = col_annotation[,"Marker", drop = F],
           gaps_row=c(13,18,24),
           scale = "row",
           show_rownames = T,
           show_colnames = F,
           fontsize_row = 8,
           annotation_colors = QuantSeq_colors,
           border_color = NA,
           cluster_rows = F,
           cluster_cols = F,
           annotation_legend = F,
           color = colorRampPalette(c("steelblue","white","red"))(100),
           silent = T)

figure_5d
Heatmap of expression of stem cell (yellow) and lineage-specific (neuronal – purple, astrocytic – green, and oligodendrocytic – orange) genes, comparing sgCtrl and sgFosl11 p53-null _KrasG12V NSCs. Two biological replicates are shown.
figure_5e <- figure_5E_data %>%
  ggplot(aes(x = sgRNA, y = norm_value, color = sgRNA)) +
  geom_boxplot(outlier.size = 0, outlier.stroke = 0) +
  geom_jitter(position = position_jitter(width = .25),
              size = 1, alpha = 0.5) +
  ylab("Fold change (A.U.)") + xlab("") + theme_bw() +
  facet_wrap(.~ Marker, scales = "free") +
  theme(legend.position = "none",
        axis.title.y = element_text(size = 10)) +
  scale_color_manual(values = black_red_green) +
  stat_compare_means(method = "t.test",
                     ref.group = "sgCtrl",
                     label = "p.signif",
                     symnum.args = symnum.args)

figure_5e
Quantification of pixel area (fold-change relative to sgCtrl) of CD44, GFAP, and OLIG2 relative to DAPI pixel area per field of view in control and Fosl1 KO p53-null KrasG12V NSCs.
Data from a representative of two independent experiments; Student’s t test, relative to sgCtrl: ***p≤0.001.
figure_5i <-  qPCR_data %>%
  plotqPCR(panel = "5I",
           normalizer = "Gapdh",
           ref_group = "sgCtrl-T4",
           levels = c("sgCtrl-T4","sgFosl1-T3","sgFosl1-T4"),
           pvalue = T,
           legend = "none",
           palette = black_red_green,
           ylim = c(0,1.5),
           title = "MES genes")

figure_5i
mRNA expression of MES genes in the samples sgCtrl–T4 (higher FRA-1 expression) and sgFosl1_1–T3 and –T4 (no detectable FRA-1 expression).
figure_5j <- qPCR_data %>%
  plotqPCR(panel = "5J",
           normalizer = "Gapdh",
           ref_group = "sgCtrl-T4",
           levels = c("sgCtrl-T4","sgFosl1-T3","sgFosl1-T4"),
           pvalue = T,
           legend = "right",
           palette = black_red_green,
           ylim = c(0,50),
           title = "PN genes")

figure_5j
mRNA expression of PN genes in samples as in (H).
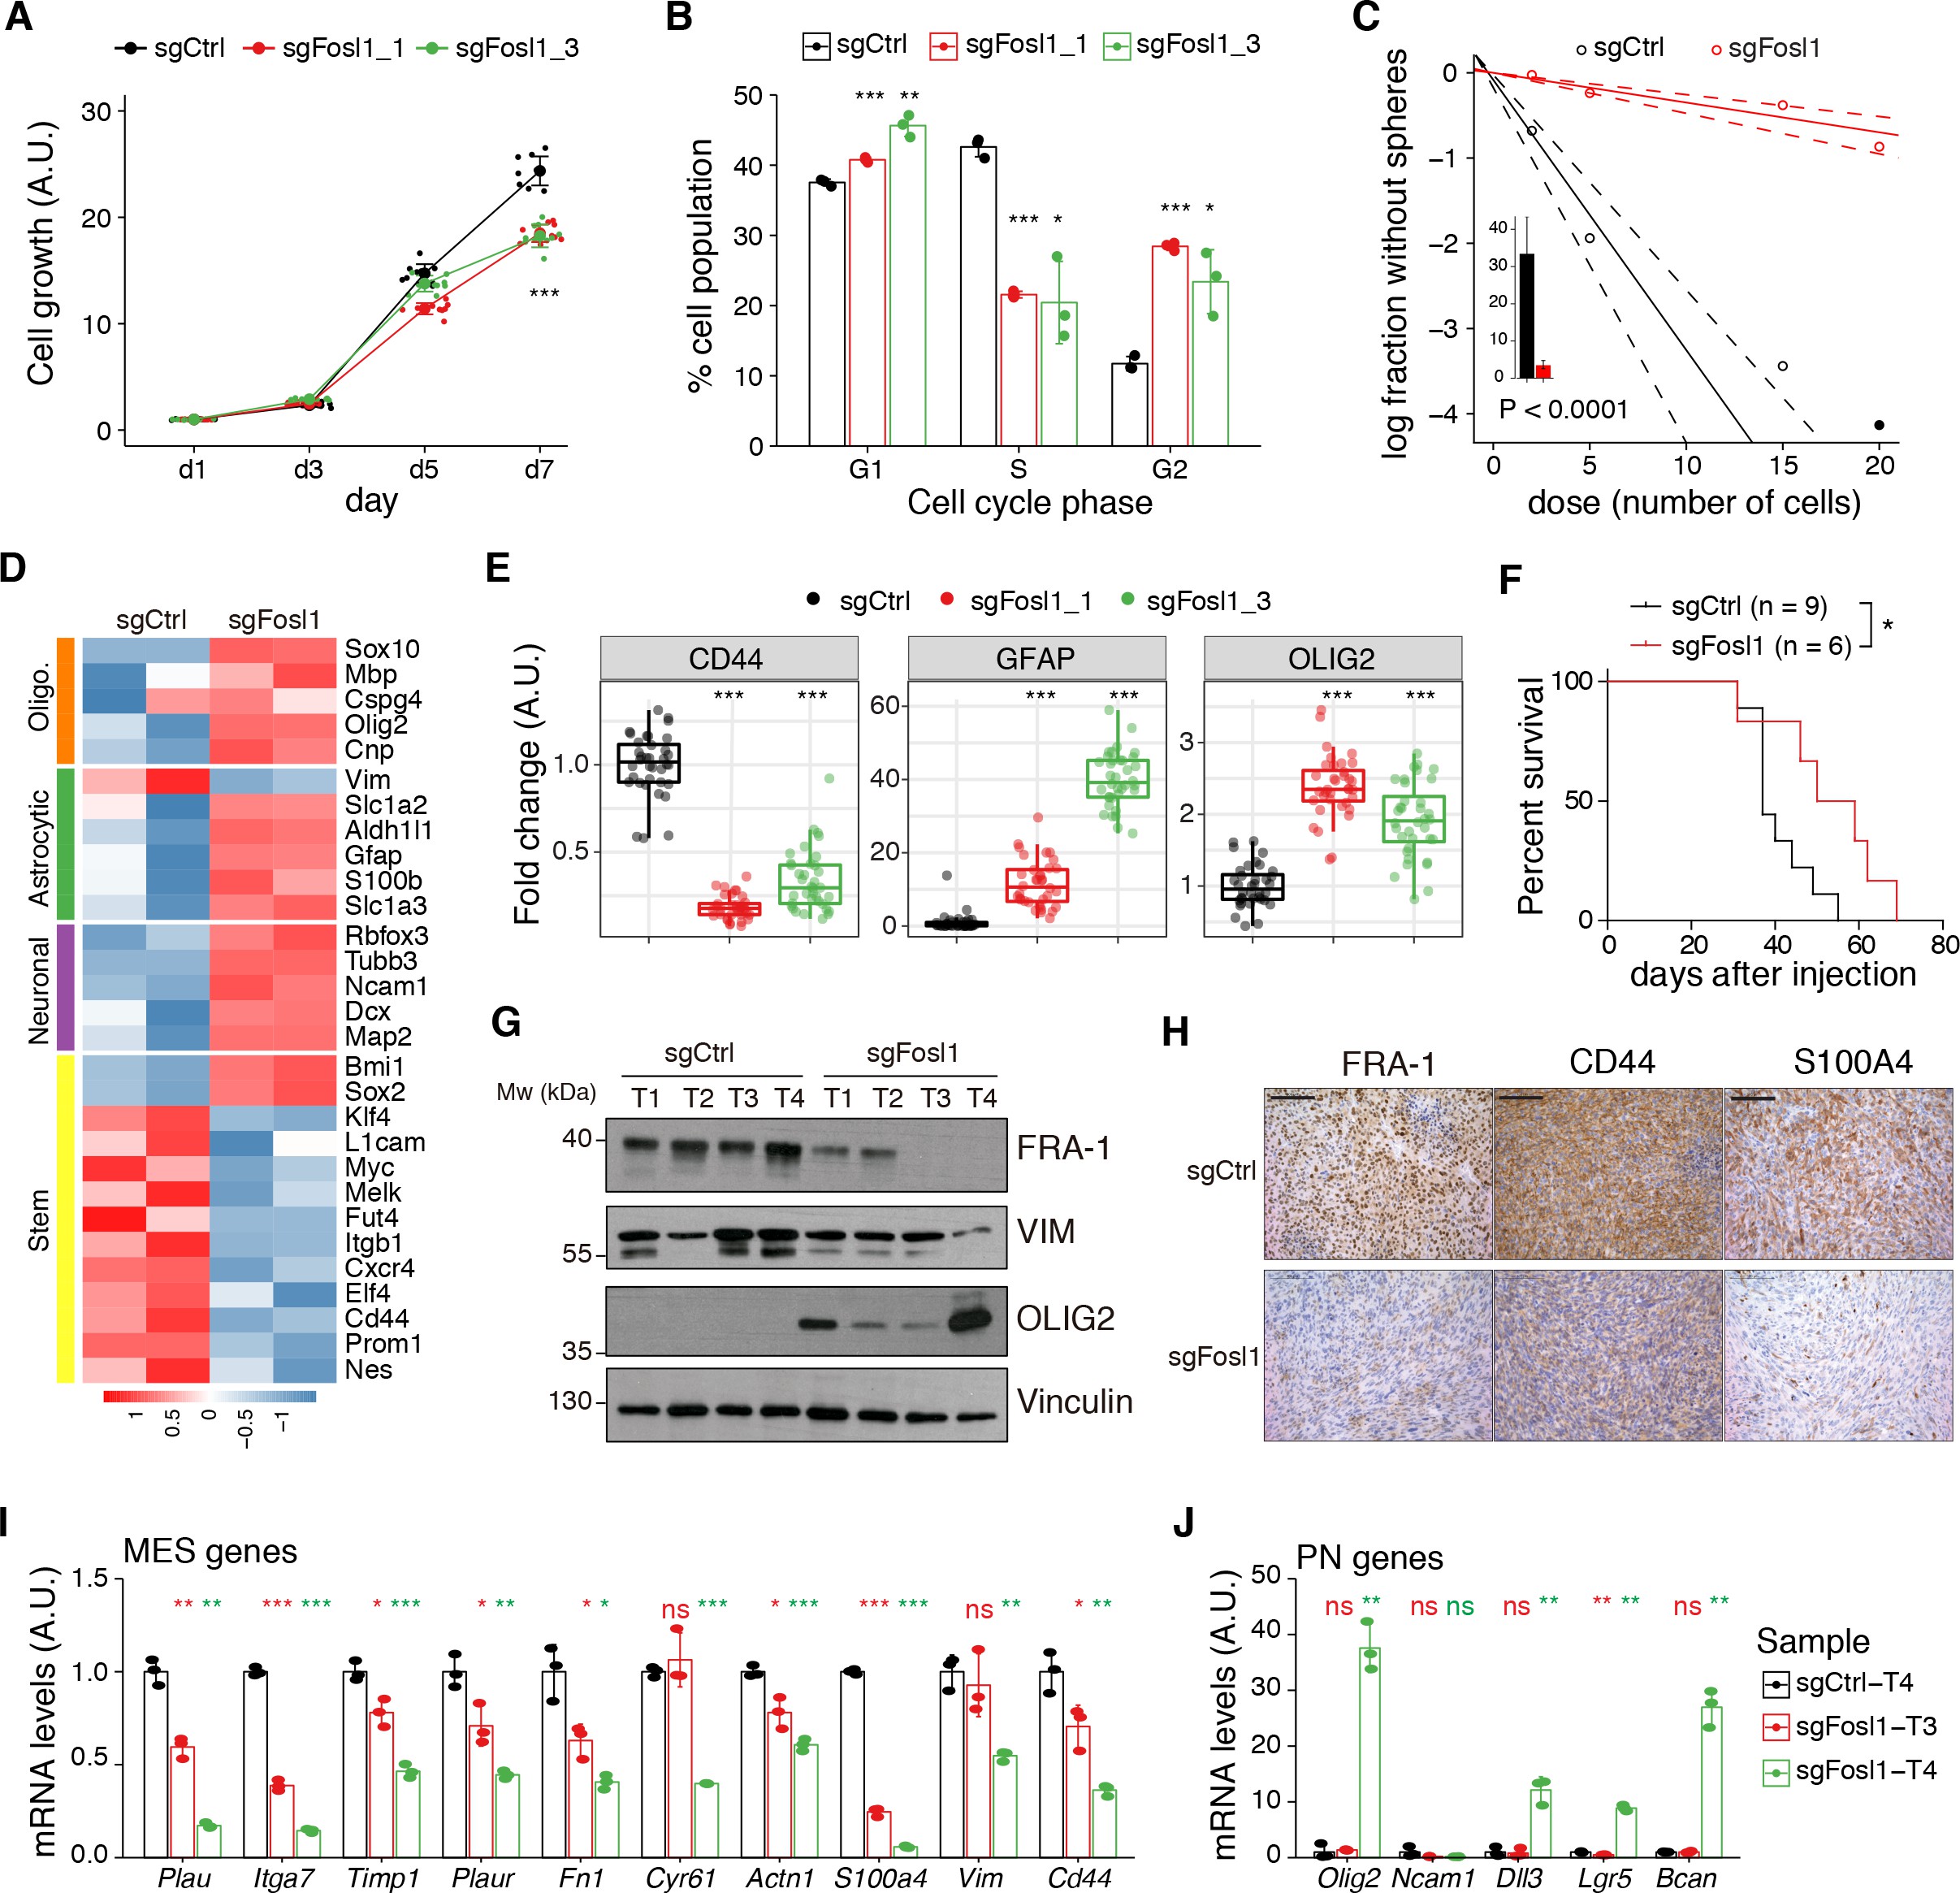
Fosl1 knock-out (KO) impairs cell growth and stemness in vitro and increases survival in a orthotopic glioma model.
(A) Cell viability of control and Fosl1 KO p53-null KrasG12V neural stem cells (NSCs) measured by MTT assay; absorbance values were normalized to day 1. Data from a representative of three independent experiments are presented as mean ± SD (n = 10, technical replicates). Two-way ANOVA, relative to sgCtrl for both sgFosl1_1 and sgFosl1_3: ***p≤0.001. (B) Quantification of cell cycle populations of control and Fosl1 KO p53-null KrasG12V NSCs by flow cytometry analysis of PI staining. Data from a representative of two independent experiments are presented as mean ± SD (n = 3, technical replicates). Student’s t test, relative to sgCtrl: *p≤0.05; **p≤0.01; ***p≤0.001. (C) Representative limiting dilution experiment on p53-null KrasG12V sgCtrl and sgFosl1_1 NSCs, calculated with extreme limiting dilution assay (ELDA) analysis; bar plot inlet shows the estimated stem cell frequency with the confidence interval; chi-square p<0.0001. (D) Heatmap of expression of stem cell (yellow) and lineage-specific (neuronal – purple, astrocytic – green, and oligodendrocytic – orange) genes, comparing sgCtrl and sgFosl1_1 p53-null KrasG12V NSCs. Two biological replicates are shown. (E) Quantification of pixel area (fold-change relative to sgCtrl) of CD44, GFAP, and OLIG2 relative to DAPI pixel area per field of view in control and Fosl1 KO p53-null KrasG12V NSCs. Data from a representative of two independent experiments; Student’s t test, relative to sgCtrl: ***p≤0.001. (F) Kaplan–Meier survival curves of nu/nu mice injected with p53-null KrasG12V sgCtrl (n = 9) and sgFosl1_1 (n = 6) NSCs. Log-rank p=0.0263. (G) Western blot analysis using the indicated antibodies of four sgCtrl and four sgFosl1_1 tumors (showing low or no detectable expression of FRA-1); vinculin was used as loading control. (H) Representative images of IHCs using the indicated antibodies. Scale bars represent 100 µm. (I) mRNA expression of MES genes in the samples sgCtrl–T4 (higher FRA-1 expression) and sgFosl1_1–T3 and –T4 (no detectable FRA-1 expression). (J) mRNA expression of PN genes in samples as in (H). Data from a representative of two experiments are presented as mean ± SD (n = 3, technical replicates), normalized to Gapdh expression. Student’s t test for sgFosl1_1 tumors, relative to sgCtrl–T4: ns = not significant, *p≤0.05, **p≤0.01, ***p≤0.001.
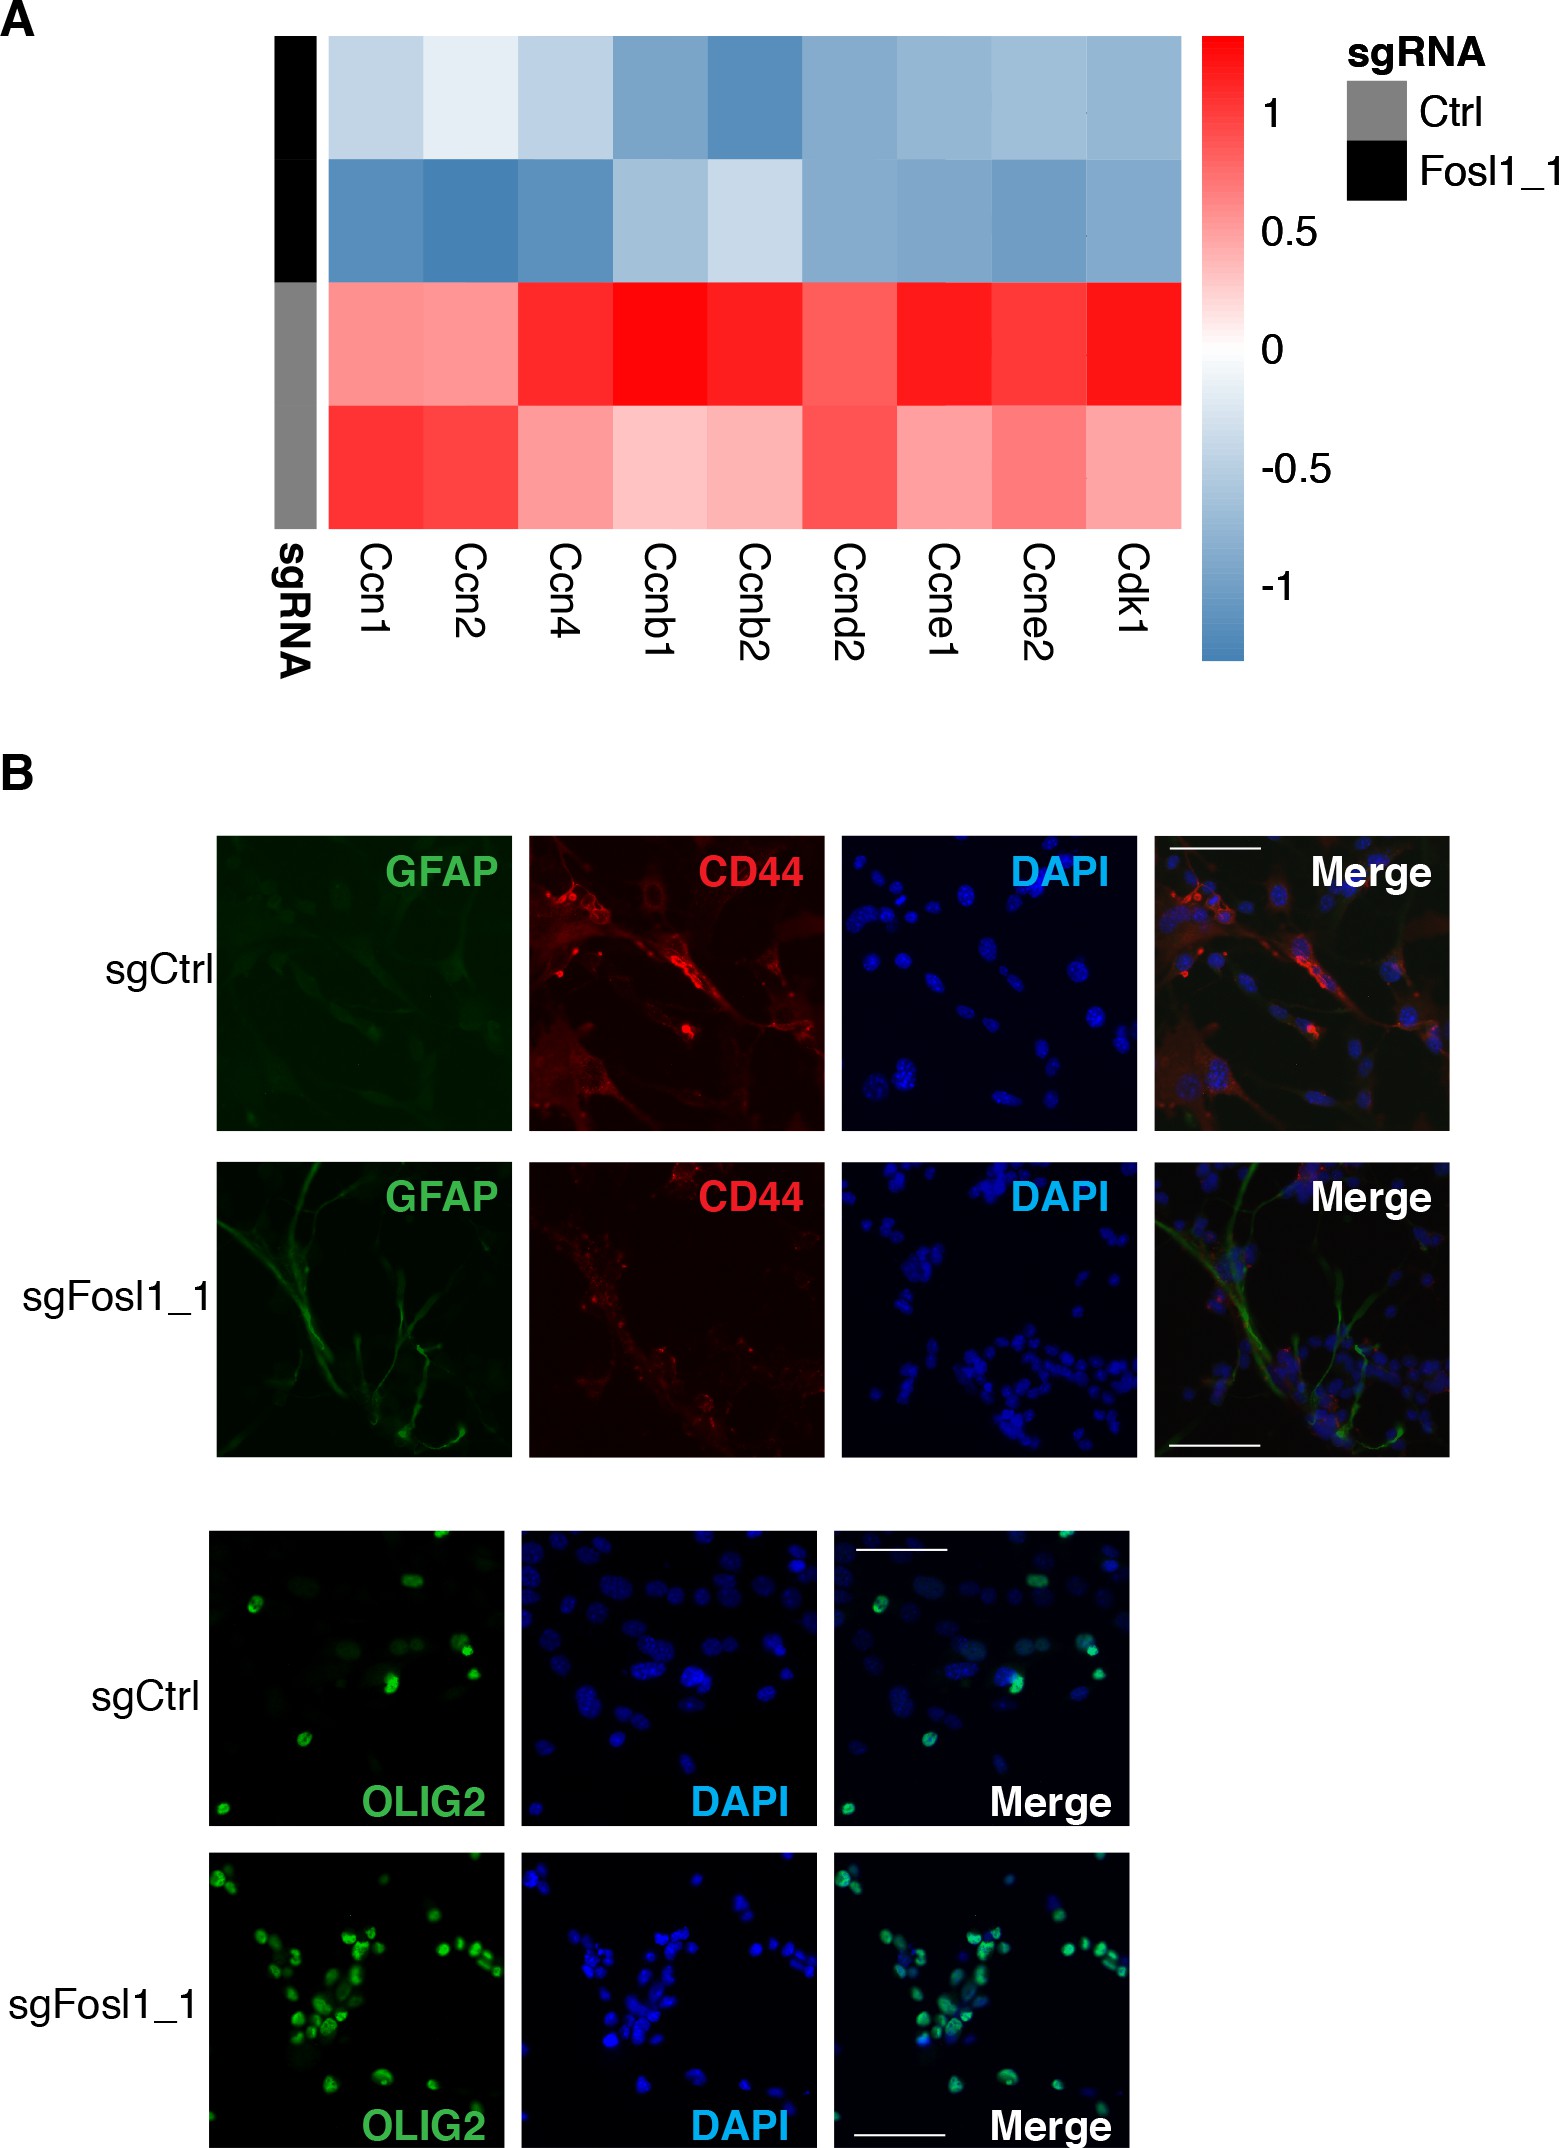
Fosl1 loss is associated with the reduction of proliferative genes and increase in differentiation genes.
(A) Heatmap showing a reduction in expression of cell cycle regulators in sgFosl1_1 as compared to sgCtrl p53-null KrasG12V neural stem cells (NSCs). (B) Representative images of immunofluorescence staining of the indicated markers in sgCtrl and sgFosl1_1 p53-null KrasG12V NSCs plated on laminin-coated coverslips. Scale bars represent 50 µm.
Another aspect that contributes to GBM aggressiveness is its heterogeneity, attributable in part to the presence of GSCs. By using limiting dilution assays, we found that Fosl1 is required for the maintenance of stem cell activity, with a stem cell frequency estimate of sgFosl1_1 = 28.6 compared to sgCtrl = 3 (chi-square p<2.2e-16) (Figure 5C). Moreover, RNA-seq analysis showed that sgFosl1_1 cells downregulated the expression of stem genes (Elf4, Klf4, Itgb1, Nes, Sall4, L1cam, Melk, Cd44, Myc, Fut4, Cxcr4, Prom1) while upregulating the expression of lineage-specific genes: neuronal (Map2, Ncam1, Tubb3, Slc1a2, Rbfox3, Dcx), astrocytic (Aldh1l1, Gfap, S100b, Slc1a3), and oligodendrocytic (Olig2, Sox10, Cnp, Mbp, Cspg4) (Figure 5D). The different expression of some of the stem/differentiation markers was confirmed also by immunofluorescence analysis. While Fosl1 KO cells presented low expression of the stem cell marker CD44, differentiation markers as GFAP and OLIG2 were significantly higher when compared to sgCtrl cells (Figure 5E and Figure 5—figure supplement 1B).
We then sought to test whether (i) p53-null KrasG12V NSCs were tumorigenic and (ii) Fosl1 played any role in their tumorigenic potential. Intracranial injections of p53-null KrasG12V NSCs in nu/nu mice led to the development of high-grade tumors with a median survival of 37 days in control cells (n = 9). In contrast, sgFosl1_1-injected mice (n = 6) had a significant increase in median survival (54.5 days, log-rank p=0.0263) (Figure 5F). Consistent with our in vitro experiments (Figure 3D–F), Fosl1-depleted tumors failed to support mesenchymal program (Figure 5G–I). Western blot, immunohistochemical, and qPCR analysis show the reduction of MES markers (VIM, CD44, and S100A4) and the expression of the PN marker OLIG2 to depend on Fosl1 expression (Figure 5G–J).
Overall, our data in p53-null Kras mutant NSCs support the conclusion that, besides controlling cell proliferation, Fosl1 plays a critical role in the maintenance of the stem cell activity and tumorigenicity.
Fosl1 amplifies mesenchymal gene expression
To further assess the role of Fosl1 as a key player in the control of the MGS, we used a mouse model of inducible Fosl1 overexpression containing the alleles KrasLSLG12V; Trp53lox; ROSA26LSLrtTA-IRES-EGFP; Col1a1TetO-Fosl1 (here referred to as Fosl1tetON). Similar to the loss-of-function approach here used, this allelic combination allows the expression of KrasG12V and deletion of p53 after Cre recombination. Moreover, the expression of the reverse tetracycline transactivator (rtTA) allows, upon induction with doxycycline (Dox), the ectopic expression of Fosl1 (Flag tagged), under the control of the Col1a1 locus and a tetracycline‐responsive element (TRE or Tet-O) 8Belteki200542Hasenfuss et al.2014.
NSCs derived from Fosl1WT and Fosl1tetON mice were infected in vitro with a lentiviral vector expressing the Cre recombinase and efficient infection was confirmed by fluorescence microscopy as the cells expressing the rtTA should express GFP (data not shown). FRA-1 overexpression, as well as Flag-tag expression, was then tested by western blot after 72 hr of Dox induction (Figure 6A). When Fosl1tetON NSCs were analyzed by qRT-PCR for the expression of MES/PN markers, a significant upregulation of most MES genes and downregulation of PN genes was found in the cells overexpressing Fosl1 (Figure 6B, C), thereby complementing our findings in Fosl1 KO cells.
figure_6b_left <- qPCR_data %>%
  filter(Gene %in% c("Gapdh","Fosl1")) %>%
  plotqPCR(panel = "6B",
           normalizer = "Gapdh",
           ref_group = "Mock",
           levels = c("Mock","Dox"),
           pvalue = T,
           legend = "none",
           palette = gray_black,
           ylim=c(0,200),
           title = "MES genes")

figure_6b_right <- qPCR_data %>%
  filter(Gene!= "Fosl1") %>%
  plotqPCR(panel = "6B",
           normalizer = "Gapdh",
           ref_group = "Mock",
           levels = c("Mock","Dox"),
           pvalue = T, ylab = FALSE,
           legend = "none",
           palette = gray_black,
           ylim=c(0,15),
           title = " ")

figure_6b <- plot_grid(figure_6b_left,
                       figure_6b_right,
                       rel_widths = c(0.3,1))

figure_6b
mRNA expression of Fosl1 and mesenchymal (MES) genes in Fosl1tetON p53-null KrasG12V cells upon 72 hr induction with 1 µg/mL Dox.
figure_6c <- qPCR_data %>%
  plotqPCR(panel = "6C",
           normalizer = "Gapdh",
           ref_group = "Mock",
           levels = c("Mock","Dox"),
           pvalue = T,
           legend = "right",
           palette = gray_black,
           ylim=c(0,1.5),
           title = "PN genes")

figure_6c
mRNA expression of PN genes in Fosl1tetON p53-null KrasG12V cells upon 72 hr induction with 1 µg/mL Dox.
figure_6d <- figure_6D_data %>%
  ggplot(aes(x = Group, y = Area_scaled, color = Group)) +
  geom_boxplot(outlier.size = 0, outlier.stroke = 0) +
  geom_jitter(position = position_jitter(width = .25), size = 1) +
  ylab("Tumor Area") + xlab("") + theme_bw() + ylim(0,2.8) +
  theme(legend.position = "none",  axis.title.y = element_text(size = 10)) +
  scale_color_manual(values = c("#A6CEE3", "#1F78B4")) +
  stat_compare_means(method = "t.test", ref.group = "Mock",
                     label = "p.format", symnum.args = symnum.args)

figure_6d
Quantification of tumor area (µm2) of –Dox and +Dox tumors (n = 8/8). For each mouse, the brain section on the hematoxylin and eosin (H&E) slide with a larger tumor was considered and quantified using the ZEN software (Zeiss).
figure_6f_left <- qPCR_data %>%
  filter(Gene %in% c("Gapdh","Fosl1")) %>%
  plotqPCR(panel = "6F",
           normalizer = "Gapdh",
           ref_group = "Mock",
           levels = c("Mock","Dox"),
           pvalue = T,
           legend = "none",
           palette = c("#A6CEE3", "#1F78B4"),
           ylim=c(0,40),
           title = "MES genes")

figure_6f_right <- qPCR_data %>%
  filter(Gene!= "Fosl1") %>%
  plotqPCR(panel = "6F",
           normalizer = "Gapdh",
           ref_group = "Mock",
           levels = c("Mock","Dox"),
           pvalue = T, ylab = FALSE,
           legend = "none",
           palette = c("#A6CEE3", "#1F78B4"),
           ylim=c(0,6),
           title = " ")

figure_6f <- plot_grid(figure_6f_left,
                       figure_6f_right,
                       rel_widths = c(0.3,1))

figure_6f
mRNA expression of Fosl1 and MES genes in tumorspheres in the absence or presence of Dox for 19 days.
figure_6g <- qPCR_data %>%
  plotqPCR(panel = "6G",
           normalizer = "Gapdh",
           ref_group = "Mock",
           levels = c("Mock","Dox"),
           pvalue = T,
           legend = "right",
           palette = c("#A6CEE3", "#1F78B4"),
           ylim=c(0,2),
           title = "PN genes")

figure_6g
mRNA expression of PN genes in tumorspheres in the absence or presence of Dox for 19 days.
figure_6i <- qPCR_data %>%
  plotqPCR(panel = "6I",
           normalizer = "Gapdh",
           ref_group = "Dox",
           levels = c("Dox","Mock"),
           pvalue = T,
           legend = "none",
           palette = c("#E31A1C","#FB9A99"),
           ylim=c(0,2.5),
           title = "MES genes")

figure_6i
mRNA expression of Fosl1 and MES genes in tumorspheres in the presence or absence of Dox for 19 days.
figure_6j <- qPCR_data %>%
  plotqPCR(panel = "6J",
           normalizer = "Gapdh",
           ref_group = "Dox",
           levels = c("Dox","Mock"),
           pvalue = T,
           legend = "right",
           palette = c("#E31A1C","#FB9A99"),
           ylim=c(0,10),
           title = "PN genes")

figure_6j
mRNA expression of PN genes in tumorspheres in the presence or absence of Dox for 19 days. qRT-PCR data from a representative of two experiments are presented as mean ± SD (n = 3, technical replicates), normalized to Gapdh expression.
Student’s t test, relative to the respective control (−Dox in B, C, F, and G; +Dox in I and J): ns = not significant, *p≤0.05, **p≤0.01, ***p≤0.001.
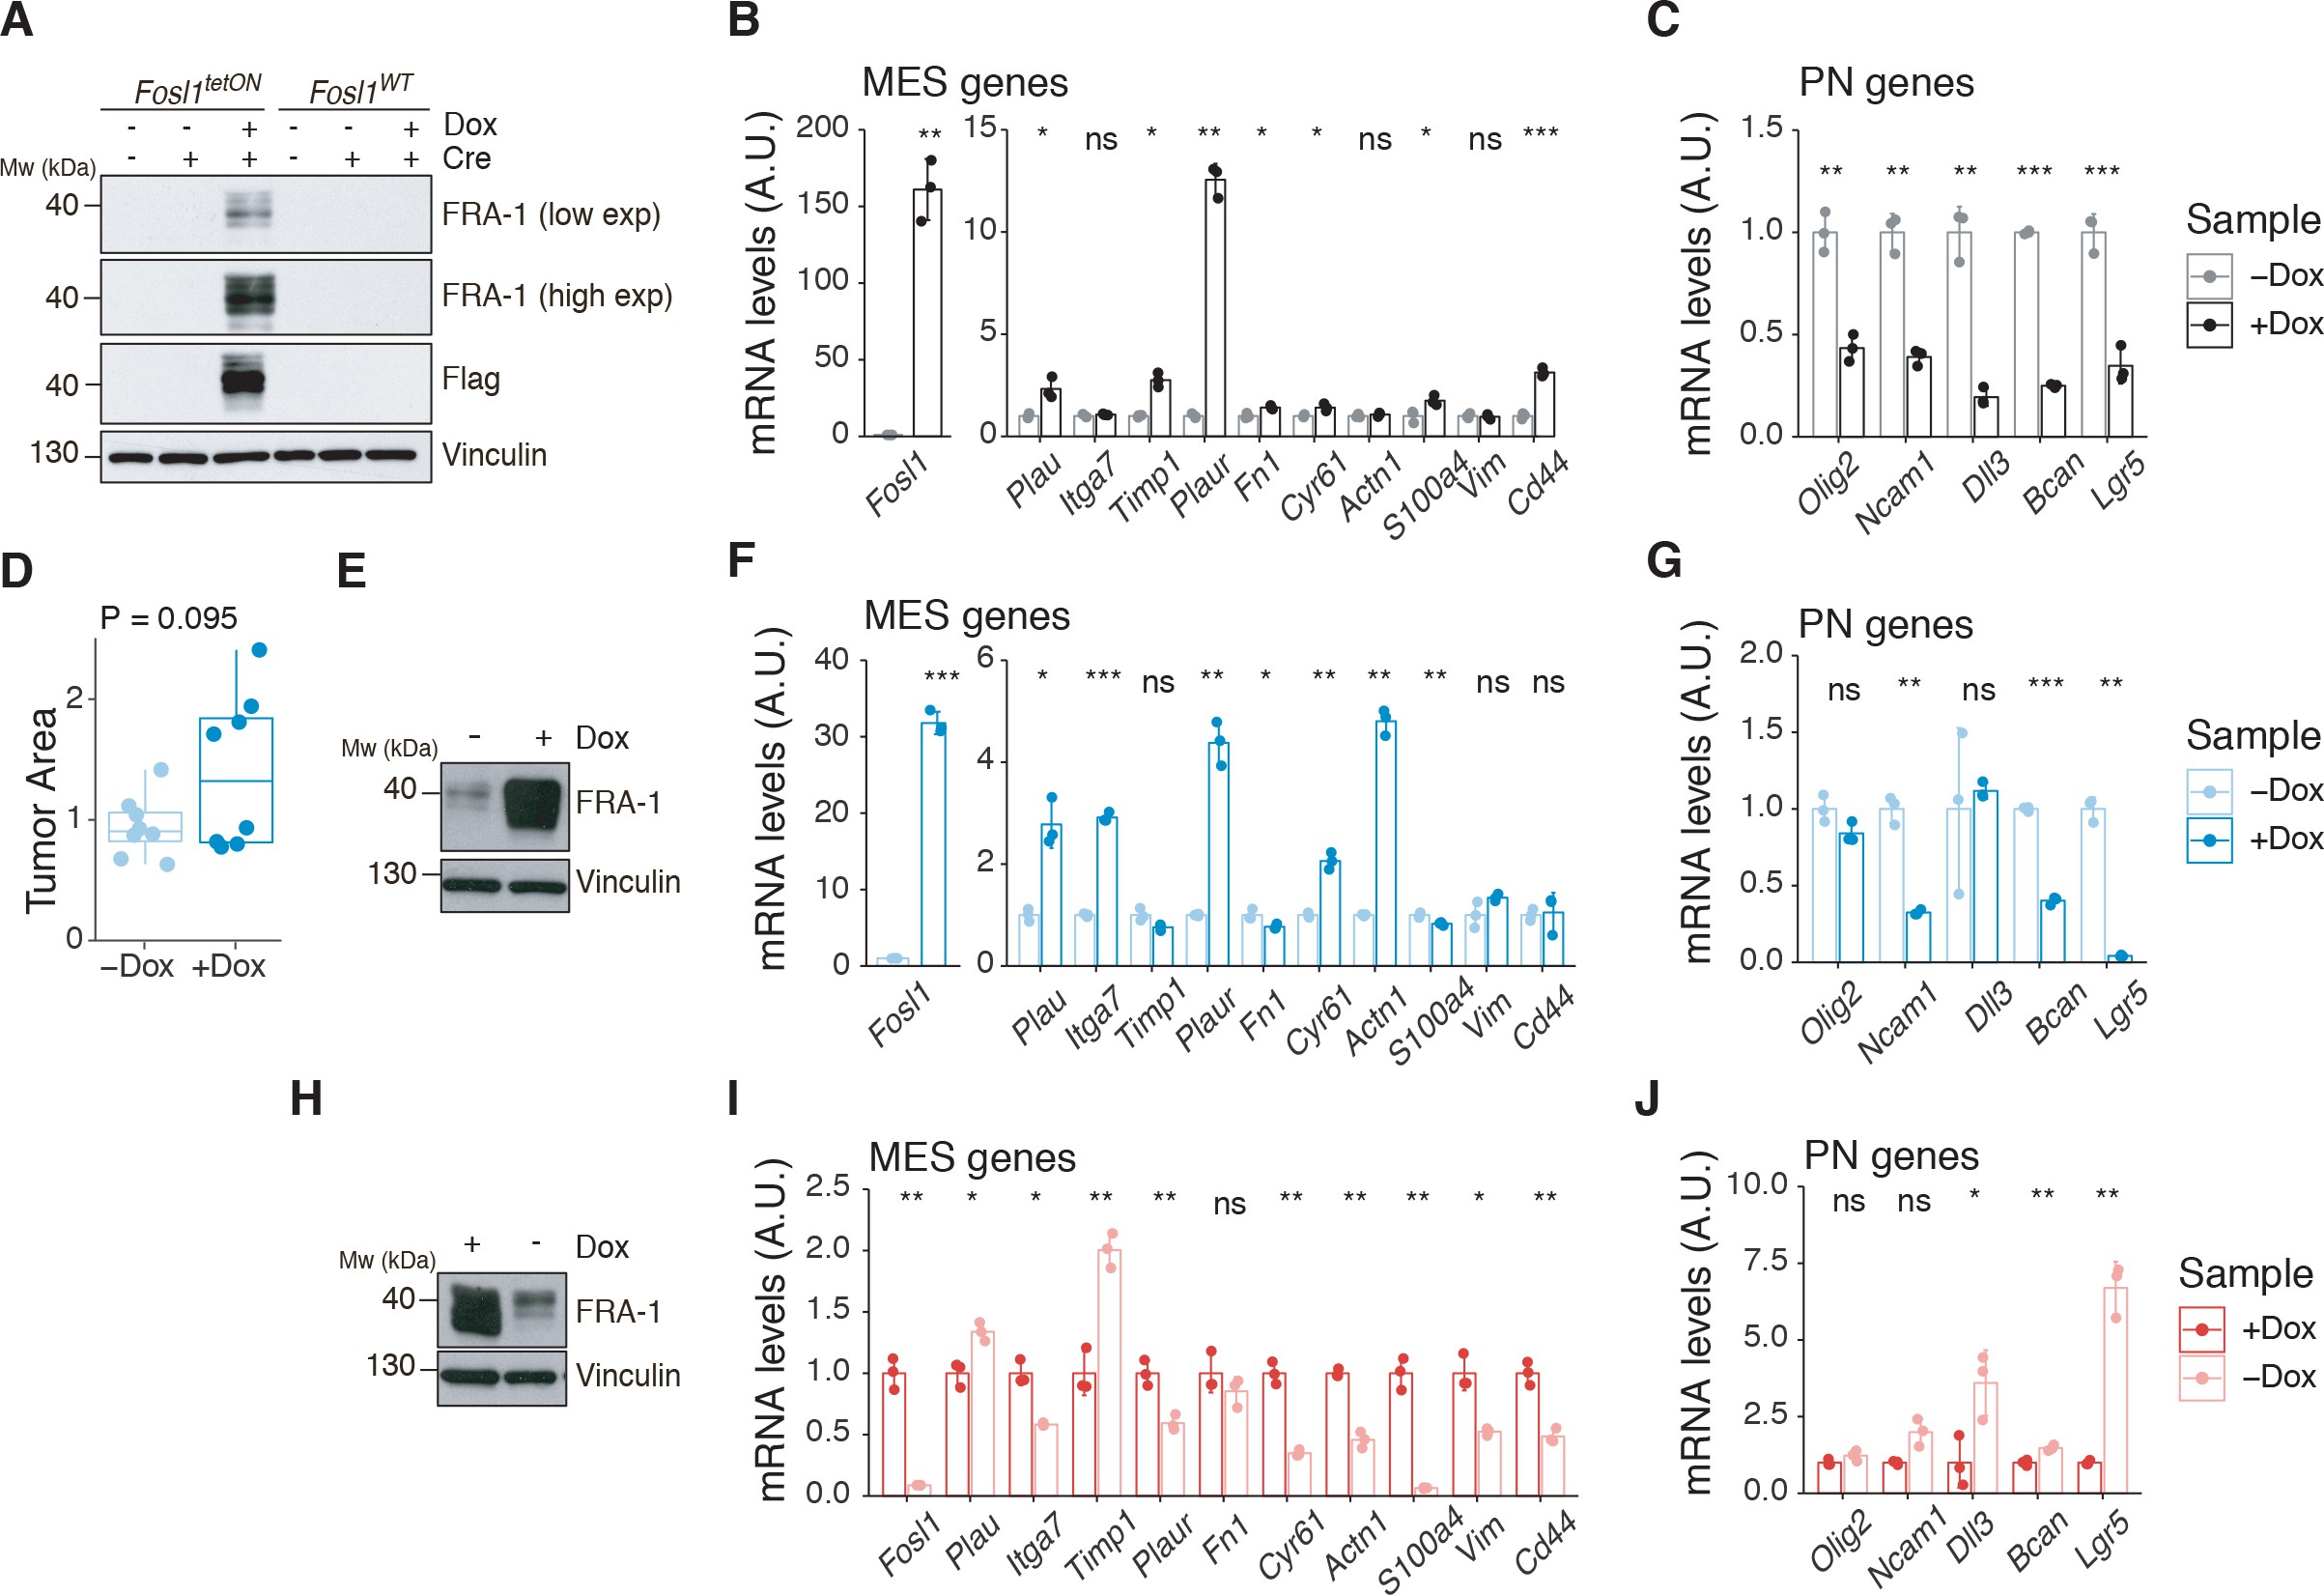
Fosl1 overexpression upregulates the MES gene signature (MGS) and induces larger tumors in vivo.
(A) Western blot analysis of FRA-1 and Flag expression on Fosl1tetON and Fosl1WT neural stem cells (NSCs) derived from KrasLSLG12V; Trp53lox; ROSA26LSLrtTA-IRES-EGFP; Col1a1TetO-Fosl1 mice upon in vitro infection with Cre and induction of Fosl1 overexpression with 1 µg/mL doxycycline (Dox) for 72 hr; vinculin was used as loading control. (B) mRNA expression of Fosl1 and mesenchymal (MES) genes in Fosl1tetON p53-null KrasG12V cells upon 72 hr induction with 1 µg/mL Dox. (C) mRNA expression of PN genes in Fosl1tetON p53-null KrasG12V cells upon 72 hr induction with 1 µg/mL Dox. (D) Quantification of tumor area (µm2) of –Dox and +Dox tumors (n = 8/8). For each mouse, the brain section on the hematoxylin and eosin (H&E) slide with a larger tumor was considered and quantified using the ZEN software (Zeiss). (E) Western blot detection of FRA-1 expression in tumorspheres derived from a control (−Dox) tumor. Tumorspheres were isolated and kept without Dox until first passage, when 1 µg/mL Dox was added and kept for 19 days (+Dox in vitro). (F) mRNA expression of Fosl1 and MES genes in tumorspheres in the absence or presence of Dox for 19 days. (G) mRNA expression of PN genes in tumorspheres in the absence or presence of Dox for 19 days. (H) Western blot detection of FRA-1 expression in tumorspheres derived from a Fosl1 overexpressing (+Dox) tumor. Tumorspheres were isolated and kept with 1 µg/mL Dox until first passage, when Dox was removed for 19 days (−Dox in vitro). (I) mRNA expression of Fosl1 and MES genes in tumorspheres in the presence or absence of Dox for 19 days. (J) mRNA expression of PN genes in tumorspheres in the presence or absence of Dox for 19 days. qRT-PCR data from a representative of two experiments are presented as mean ± SD (n = 3, technical replicates), normalized to Gapdh expression. Student’s t test, relative to the respective control (−Dox in B, C, F, and G; +Dox in I and J): ns = not significant, *p≤0.05, **p≤0.01, ***p≤0.001.
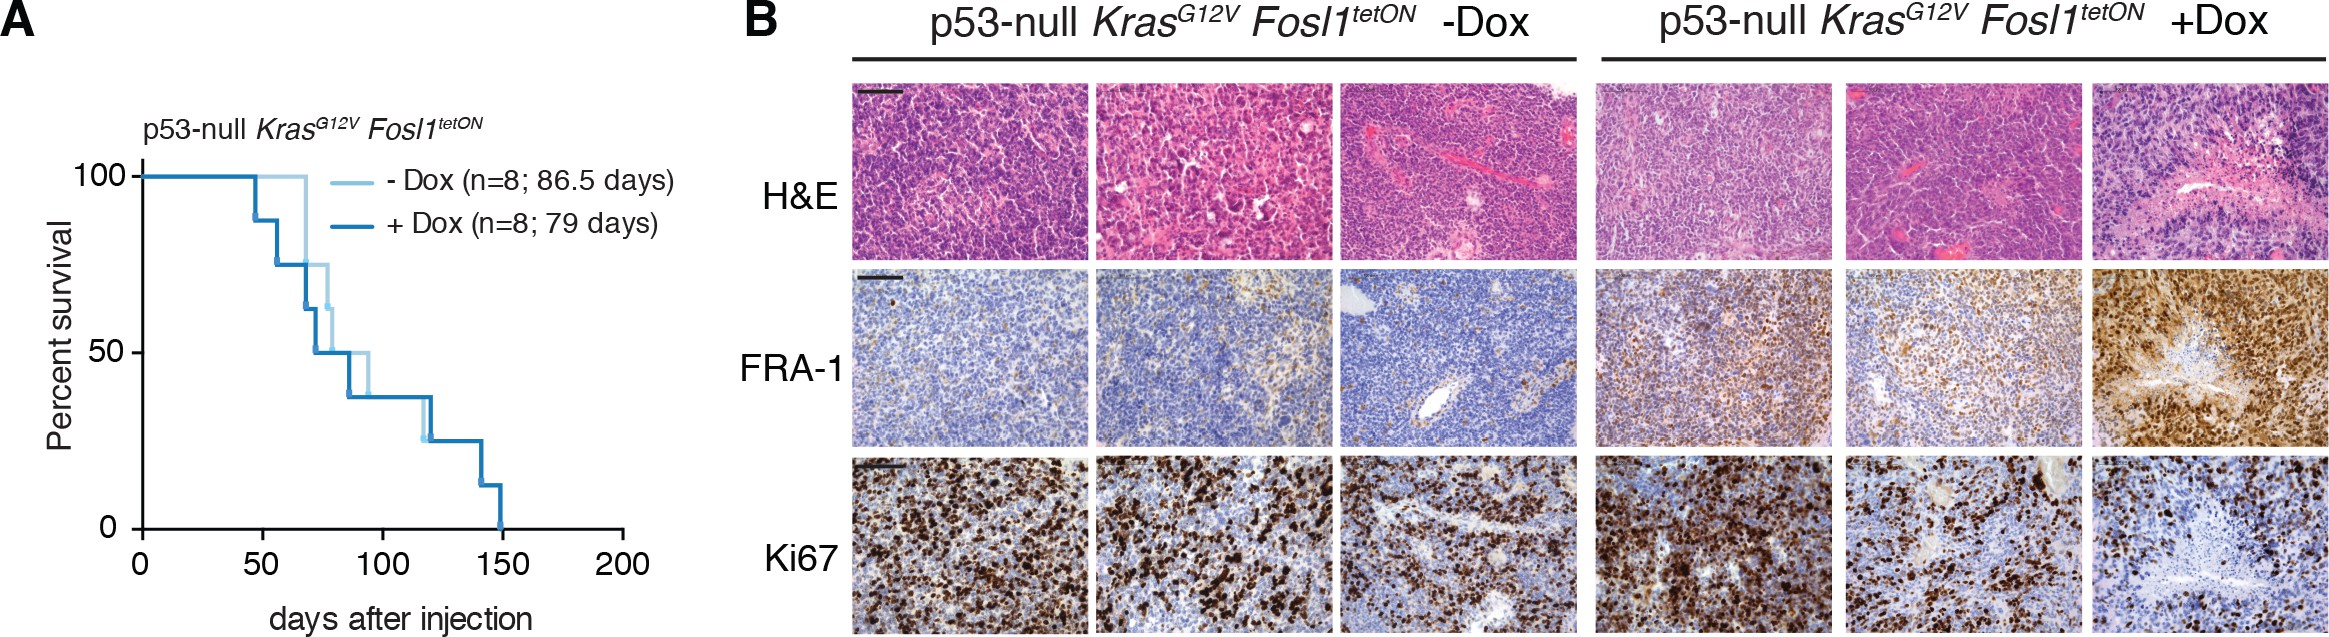
Characterization of Fosl1 overexpressing mouse tumors.
(A) Kaplan–Meier survival curves of C57BL/6J wildtype mice injected with p53-null KrasG12V Fosl1tetON neural stem cells (NSCs) subjected to doxycycline (Dox) diet (n = 8) or kept as controls (n = 8); log-rank p-value=0.814. (B) Hematoxylin and eosin (H&E) and immunohistochemical staining, using the indicated antibodies, of representative –Dox and +Dox tumors. Scale bars represent 100 µm.
To investigate if the MES phenotype induced with Fosl1 overexpression would have any effect in vivo, p53-null KrasG12V Fosl1tetON NSCs were intracranially injected into syngeneic C57BL/6J wildtype mice. Injected mice were randomized and subjected to Dox diet (food pellets and drinking water) or kept as controls with regular food and drinking water with 1% sucrose. Fosl1 overexpressing mice (+Dox) developed larger tumors that were more infiltrative and aggressive than controls (–Dox), which mostly grew as superficial tumor masses instead (Figure 6D). This phenotype appears to be independent of tumor cells proliferation as gauged by Ki-67 staining and does not affect overall survival (Figure 6—figure supplement 1A, B).
Tumorspheres were derived from –Dox and +Dox tumor-bearing mice, and Fosl1 expression was manipulated in vitro through addition or withdrawal of Dox from the culture medium. In the case of tumorspheres derived from a –Dox tumor, when Dox was added for 19 days, high levels of FRA-1 expression were detected by western blot (Figure 6E). At the mRNA level, Dox treatment also greatly increased Fosl1 expression, as well as some of the MES genes (Figure 6F), while the expression of PN genes was downregulated (Figure 6G). Conversely, when Dox was removed from +Dox-derived tumorspheres for 19 days, the expression of FRA-1 decreased (Figure 6H, I), along with the expression of MES genes (Figure 6I), while PN genes were upregulated (Figure 6J). These results confirm the essential role of Fosl1 in the regulation of the MGS in p53-null KrasG12V tumor cells and the plasticity between the PN and MES subtypes.
FOSL1 controls growth, stemness, and mesenchymal gene expression in patient-derived BTSCs
To prove the relevance of our findings in the context of human tumors, we analyzed BTSC lines characterized as non-MES (h676, h543, and BTSC 268) or MES (BTSC 349, BTSC 380, and BTSC 233) (this study and 62Ozawa et al.2014). By western blot, we found that consistent with what was observed either in human BTSCs (Figure 1D) or mouse NSCs (Figure 3A), MES cell lines expressed high levels of FRA-1 and activation of the MEK/ERK pathway (Figure 7A).
mean_7C_d1 <- figure_7C_data %>%
  filter(day == "d1") %>%
  group_by(Sample, Treatment, day) %>%
  summarise_all(mean) %>%
  dplyr::select(-day) %>%
  dplyr::rename(d1_mean = value)

figure_7C_data_norm <- full_join(figure_7C_data, mean_7C_d1,
                            by = c("Sample", "Treatment")) %>%
  mutate(value_norm = value/d1_mean,
         Sample_treatment = paste(Sample, Treatment, sep = ""))

figure_7c <- figure_7C_data_norm %>%
  ggline(x = "day", y = "value_norm",
  add = c("mean_sd", "jitter"),
  ylab = "Cell growth (A.U.)",
  add.params =list(size = 1),
  color = "Sample_treatment",
  palette = "Paired") +
  theme(legend.position = c(.05, .95),
        legend.justification = c("left", "top")) +
  font_size

# figure_7C_data_norm %>%
#   filter(Sample == "shFOSL1_10") %>%
#   aov(value_norm ~ Treatment + day, data = .) %>%
#   summary()
#
# figure_7C_data_norm %>%
#   filter(Sample == "shFOSL1_3") %>%
#   aov(value_norm ~ Treatment + day, data = .) %>%
#   summary()

# figure_7C_data_norm %>%
#   compare_means(value_norm ~ Treatment,
#                 group1 = "Mock",
#                 group2 = "Dox",
#                 method = "anova",
#                 symnum.args = symnum.args,data = .,
#                 group.by = "Sample")

figure_7c
Cell growth of BTSC 380 shGFP and shFOSL1, in the absence or presence of Dox, measured by MTT assay; absorbance values were normalized to day 1. Data from a representative of three independent experiments are presented as mean ± SD (n = 15, technical replicates).
Two-way ANOVA, –Dox vs. +Dox: ***p≤0.001.
figure_7d <- figure_7D_data %>%
  mutate(Sample = factor(Sample,
                         levels = c("shGFP", "shFOSL1_3","shFOSL1_10")),
         Sample_treatment = paste(Sample, Treatment, sep = "")) %>%
  ggbarplot(x = "Sample",
            y = "BrdU",
            position = position_dodge(0.8),
            add = c("mean_sd", "jitter"),
            ylab = "% BrdU+ cells",
            color = "Sample_treatment",
            palette = "Paired", legend = "none") +
  scale_y_continuous(expand = c(0, 0), limits = c(0,40)) + font_size

# figure_7D_data %>%
#   compare_means(BrdU ~ Treatment,
#                 ref.group = "-Dox",
#                 method = "t.test",
#                 symnum.args = symnum.args,data = .,
#                 group.by = "Sample", var.equal = T)

# figure_7D_data %>%
#   compare_means(BrdU ~ Treatment, group1 = "-Dox", group2 = "+Dox", method = "anova",
#                 symnum.args = symnum.args,data = ., group.by = "Sample")

figure_7d
BrdU of BTSC 380 shGFP and shFOSL1, in the absence or presence of Dox, analyzed by flow cytometry. Data from a representative of two independent experiments are presented as mean ± SD (n = 3, technical replicates). Student’s t test, relative to the respective control (–Dox): *p≤0.05.
elda_7e_gfp <- figure_7E_data %>%
  filter(shRNA =="shGFP") %>%
  with(.,  elda(response = Response,
                dose = Dose,
                tested = Tested,
                group = Group))

elda_7e_FOSL1_3 <- figure_7E_data %>%
  filter(shRNA =="shFOSL1_3") %>%
  with(.,  elda(response = Response,
                dose = Dose,
                tested = Tested,
                group = Group))

elda_7e_FOSL1_10 <- figure_7E_data %>%
  filter(shRNA =="shFOSL1_10") %>%
  with(.,  elda(response = Response,
                dose = Dose,
                tested = Tested,
                group = Group))

# elda_7e_gfp; elda_7e_FOSL1_3; elda_7e_FOSL1_10 # Pvalue for the limited dilution assay

# elda_bar(elda_7e_gfp, brewer.pal(6,"Paired")[5:6])
# elda_bar(elda_7e_FOSL1_3, brewer.pal(6,"Paired")[3:4])
# elda_bar(elda_7e_FOSL1_10, brewer.pal(6,"Paired")[1:2])
#

figure_7e <- plot_grid(ggplotlimdil(elda_7e_gfp,
                                    col.group = brewer.pal(6,"Paired")[5:6]) +
                         font_size,
                       ggplotlimdil(elda_7e_FOSL1_3,
                                    col.group = brewer.pal(6,"Paired")[3:4]) +
                         font_size,
                       ggplotlimdil(elda_7e_FOSL1_10,
                                    col.group = brewer.pal(6,"Paired")[1:2]) +
                         font_size,
                       nrow = 1)

figure_7e
Representative limiting dilution analysis on BTSC380 for shGFP and shFOSL1, in the presence or absence of Dox, calculated with extreme limiting dilution assay (ELDA) analysis; bar plot inlets show the estimated stem cell frequency with the confidence interval; chi-square p-values are indicated.
#PCA
pc  <-  prcomp(t(figure_7F_data[,-c(1:12)]))
pc_matrix <- data.frame(pc$x)
percentage <- round(pc$sdev^2/ sum(pc$sdev^2) * 100, 2)
percentage <- paste(colnames(pc_matrix), "(",
                    paste(as.character(percentage), "%", ")", sep=""),sep = "")
pc_matrix$Group <- figure_7F_annotation$Group

figure_7f <- pc_matrix %>%
    ggscatter(x = "PC1", y = "PC2",
             size = 1.5,
             color = "Group",
             palette = c("orange","maroon1"),
             ellipse = F,
             xlab = percentage[1],
             ylab = percentage[2],
             legend = c(0.8,0.25)) +
  font_size

figure_7f
Principal component analysis of H3K27Ac signal over FOSL1/FRA-1 binding sites, calculated using MACS on ENCODE samples (see Materials and methods), in non-MES (n = 10) and MES BTSC (n = 10) (from 53Mack et al.2019).
# BTSC_MES_probes <- figure_7G_data %>%
#   filter(Feature %in% BTSC_MES) %>%
#   arrange(-Log2.Fold.Change)

# Wang_MES_probes <- figure_7G_data %>%
#   filter(Feature %in% Wang_MES) %>%
#   arrange(-Log2.Fold.Change)

#Volcano plot
figure_7g <- figure_7G_data %>%
    mutate(Fold_group = case_when(Log2.Fold.Change > 2 ~ "Lfc>",
                                Log2.Fold.Change < -2 ~ "Lfc<-",
                                TRUE ~ "Lfc")) %>%
    ggplot(aes(x = Log2.Fold.Change, y = -log10(P.value))) +
    geom_point(aes(col = Fold_group),size = 0.01, alpha = 0.5) +
    scale_color_manual(values = c("gray","steelblue","red")) +
    xlim(-5.5,5.5) + ylim(0,45) +
    geom_vline(xintercept = 0, colour="grey", linetype="dashed") +
    theme_pubr(legend = "none") + font_size +
    ggtitle("MES vs Non-MES")

figure_7g
Volcano plot illustrating the log2 fold-change differences in H3K27Ac signal between non-MES and MES BTSCs against the p-value for that difference.
Blue and red probes represent statistically significant differences (FDR < 0.005) in H3K27Ac signal between non-MES and MES BTSCs.
figure_7j <- qPCR_data %>%
    plotChIP(panel = "7J",
             ref_group = "IgG",
             levels = c("IgG","FRA1"),
             palette = gray_black,
             pvalue =T,
             ylim=c(0,0.03),
             pvalues_y = 0.028)

figure_7j
Representative ChIP experiment in BTSC 349 cells.
The panel shows FRA-1 binding to the promoter of a subset of MES targets (n = 3, technical replicates) expressed as a percentage of the initial DNA amount in the immune-precipitated fraction. NANOG gene was used as a negative control. Student’s t test, relative to IgG: ns = not significant, **p≤0.01, ***p≤0.001.
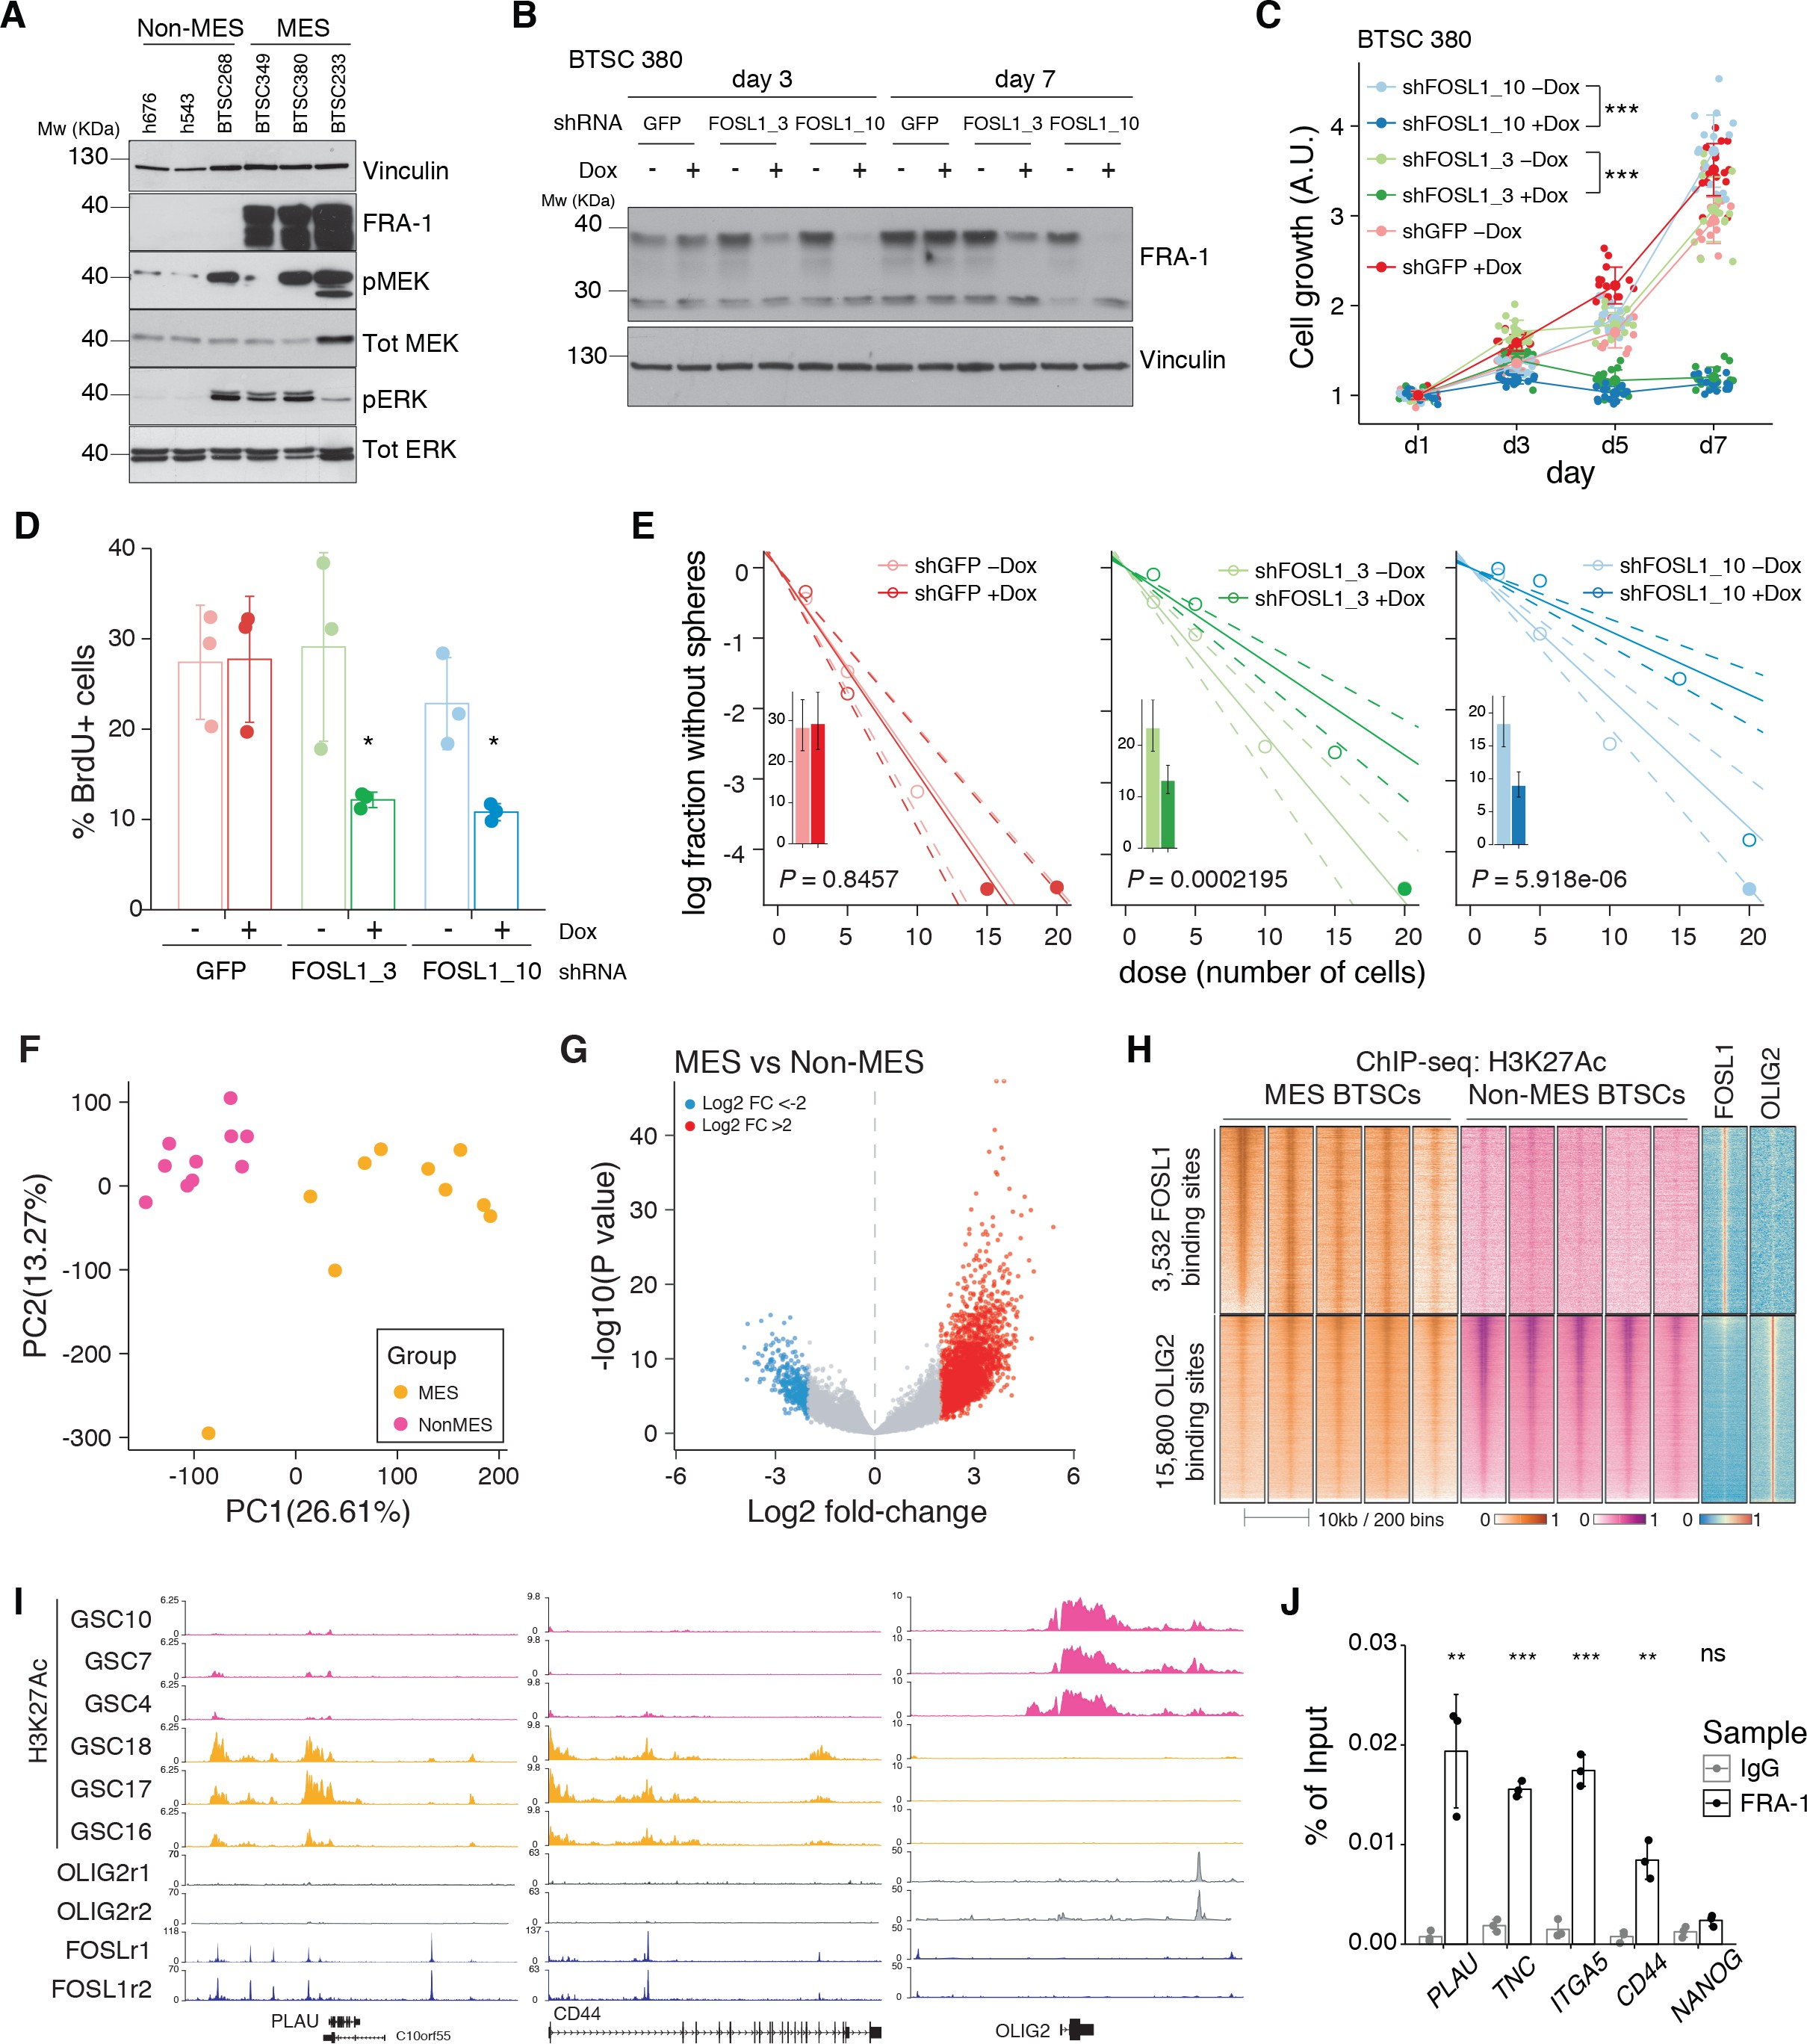
FOSL1 contributes to mesenchymal (MES) genes activation, cell growth, and stemness in MES brain tumor stem cells (BTSCs).
(A) Western blot analysis using the specified antibodies of human BTSC lines, characterized as non-MES (left) and MES (right). (B) Western blot detection of FRA-1 in MES BTSC 380 upon transduction with inducible shRNAs targeting GFP (control) and FOSL1, analyzed after 3 and 7 days of doxycycline (Dox) treatment; vinculin was used as loading control. (C) Cell growth of BTSC 380 shGFP and shFOSL1, in the absence or presence of Dox, measured by MTT assay; absorbance values were normalized to day 1. Data from a representative of three independent experiments are presented as mean ± SD (n = 15, technical replicates). Two-way ANOVA, –Dox vs. +Dox: ***p≤0.001. (D) BrdU of BTSC 380 shGFP and shFOSL1, in the absence or presence of Dox, analyzed by flow cytometry. Data from a representative of two independent experiments are presented as mean ± SD (n = 3, technical replicates). Student’s t test, relative to the respective control (–Dox): *p≤0.05. (E) Representative limiting dilution analysis on BTSC380 for shGFP and shFOSL1, in the presence or absence of Dox, calculated with extreme limiting dilution assay (ELDA) analysis; bar plot inlets show the estimated stem cell frequency with the confidence interval; chi-square p-values are indicated. (F) Principal component analysis of H3K27Ac signal over FOSL1/FRA-1 binding sites, calculated using MACS on ENCODE samples (see Materials and methods), in non-MES (n = 10) and MES BTSC (n = 10) (from 53Mack et al.2019). (G) Volcano plot illustrating the log2 fold-change differences in H3K27Ac signal between non-MES and MES BTSCs against the p-value for that difference. Blue and red probes represent statistically significant differences (FDR < 0.005) in H3K27Ac signal between non-MES and MES BTSCs. (H) Heatmap of ChIP-seq enrichment of FOSL1/FRA-1 or OLIG2 binding sites for the indicated profiles. (I) View of the PLAU, CD44, and OLIG2 loci of selected profiles. (J) Representative ChIP experiment in BTSC 349 cells. The panel shows FRA-1 binding to the promoter of a subset of MES targets (n = 3, technical replicates) expressed as a percentage of the initial DNA amount in the immune-precipitated fraction. NANOG gene was used as a negative control. Student’s t test, relative to IgG: ns = not significant, **p≤0.01, ***p≤0.001.
mean_S8B_d1 <- figure_S8B_data %>%
  filter(day == "d1") %>%
  group_by(Sample, Treatment, day) %>%
  summarise_all(mean) %>%
  dplyr::select(-day) %>%
  dplyr::rename(d1_mean = value)

figure_S8B_data_norm <- full_join(figure_S8B_data,mean_S8B_d1,
                             by = c("Sample", "Treatment")) %>%
  mutate(value_norm = value/d1_mean,
         Sample_treatment = paste(Sample, Treatment, sep = " "))

# figure_S8B_data_norm %>%
#   filter(Sample == "shFOSL1_3") %>%
#   aov(value_norm ~ Treatment * day, data = .) %>%
#   summary()

figure_S8b <- figure_S8B_data_norm %>%
  ggline(x = "day", y = "value_norm",
         add = c("mean_sd", "jitter"),
         ylab = "Cell growth (A.U.)",
         add.params =list(size = 1),
         color = "Sample_treatment",
         palette = "Paired")

figure_S8b
Cell growth of BTSC 349 shGFP and shFOSL1_3 cells, in the absence or presence of Dox, measured by MTT assay; absorbance values were normalized to day 1.
Data from a representative of three independent experiments are presented as mean ± SD (n = 15, technical replicates). Student’s t test on day 7, relative to shFOSL1_3 –Dox: ***p≤0.001.
figure_S8c <- figure_S8C_data %>%
  mutate(Sample = factor(Sample, levels = c("shGFP", "shFOSL1_3")),
         Sample_treatment = paste(Sample, Treatment, sep = "")) %>%
  ggbarplot(x = "Sample", y = "BrdU",
            position = position_dodge(0.8),
            add = c("mean_sd", "jitter"),
            ylab = "% BrdU+ cells",
            color = "Sample_treatment",
            palette = "Paired",
            legend = "none") +
  scale_y_continuous(expand = c(0, 0), limits = c(0,25))

# figure_S8C_data %>%
#   compare_means(BrdU ~ Treatment, group1 = "Mock", group2 = "Dox", method = "anova",
#                 symnum.args = symnum.args,data = ., group.by = "Sample")

# figure_S8C_data %>%
#   compare_means(BrdU ~ Treatment, ref.group = "Mock", method = "t.test",
#                 symnum.args = symnum.args,data = ., group.by = "Sample", alternative = "less", var.equal = T)

figure_S8c
BrdU incorporation of BTSC 349 shGFP and shFOSL1_3, in the absence or presence of Dox, analyzed by flow cytometry.
Data from a representative of two independent experiments are presented as mean ± SD (n = 3). Student’s t test, relative to the respective control (–Dox): ns = not significant, **p≤0.01.
elda_S8d <- elda(response = figure_S8D_data$Response,
                 dose = figure_S8D_data$Dose,
                 tested = figure_S8D_data$Tested,
                 group = figure_S8D_data$Group)

figure_S8d <- ggplotlimdil(elda_S8d,
                           col.group = brewer.pal(6,"Paired")[1:2]) +
  font_size

# elda_bar(elda_S8d, brewer.pal(6,"Paired")[1:2])

# elda_S8d # Pvalue for the limited dilution assay

figure_S8d
Representative limiting dilution analysis on BTSC 349 shFOSL1_3 in the presence or absence of Dox, calculated with extreme limiting dilution assay (ELDA) analysis; p<0.0001.
figure_S8e_left <- qPCR_data %>%
  plotqPCR(panel = "S8E_left",
           normalizer = "GAPDH",
           ref_group = "Mock",
           levels = c("Mock","Dox"),
           pvalue = T,
           title = "MES genes",
           legend = "none",
           palette = c("#A6CEE3", "#1F78B4"),
           ylim=c(0,2)) +
  theme(axis.text.x = element_text(angle = 45, hjust = 1))

figure_S8e_right <- qPCR_data %>%
  plotqPCR(panel = "S8E_right",
           normalizer = "GAPDH",
           ref_group = "Mock",
           levels = c("Mock","Dox"),
           pvalue = T,
           title = "PN genes",
           ylab = FALSE,
           legend = "right",
           palette = c("#A6CEE3", "#1F78B4"),
           ylim=c(0,4), pvalues_y = 3.7) +
  theme(axis.text.x = element_text(angle = 45, hjust = 1))

figure_S8e <- plot_grid(figure_S8e_left,
                        figure_S8e_right,
                        rel_widths = c(1.2,0.75),
                        align = "h")

figure_S8e
mRNA expression of FOSL1, MES, and PN genes in BTSC 349 shFOSL1_3 cells in the absence or presence of Dox for 3 days.
Data from a representative of three experiments are presented as mean ± SD (n = 3, technical replicates), normalized to GAPDH expression. Student’s t test, relative to –Dox: ns = not significant, *p≤0.05, **p≤0.01, ***p≤0.001.
mean_S8G_d1 <- figure_S8G_data %>%
  filter(day == "d1") %>%
  group_by(Sample, Treatment, day) %>%
  summarise_all(mean) %>%
  dplyr::select(-day) %>%
  dplyr::rename(d1_mean = value)

figure_S8G_data_norm <- full_join(figure_S8G_data,mean_S8G_d1,
                             by = c("Sample", "Treatment")) %>%
  mutate(value_norm = value/d1_mean,
         Sample_treatment = paste(Sample, Treatment, sep = " "))

# figure_S8G_data_norm %>%
#   filter(Sample == "shGFP") %>%
#   aov(value_norm ~ Treatment * day, data = .) %>%
#   summary()

figure_S8g <- figure_S8G_data_norm %>%
  ggline(x = "day", y = "value_norm",
         add = c("mean_sd", "jitter"),
         ylab = "Cell growth (A.U.)",
         add.params =list(size = 1),
         color = "Sample_treatment",
         palette = "Paired",
         legend = "right")

figure_S8g
Cell growth of BTSC 380 grown in differentiation conditions, in the absence or presence of Dox, measured by MTT assay; absorbance values were normalized to day 1.
Data from a representative of two independent experiments are presented as mean ± SD (n = 10, technical replicates).
mean_S8I_d1 <- figure_S8I_data %>%
  filter(day == "d1") %>%
  group_by(Cell_line, Group, day) %>%
  summarise_all(mean) %>%
  dplyr::select(-day) %>%
  dplyr::rename(d1_mean = value)

figure_S8I_data_norm <- full_join(figure_S8I_data,
                                  mean_S8I_d1,
                                  by = c("Cell_line", "Group")) %>%
  mutate(value_norm = value/d1_mean)

figure_S8i <- figure_S8I_data_norm %>%
  ggline(x = "day", y = "value_norm",
         facet.by = "Cell_line",
         add = c("mean_sd", "jitter"),
         ylab = "Cell growth (A.U.)",
         add.params =list(size = 1),
         color = "Group",
         palette = "Set1",
         legend = "right")

figure_S8i
Cell growth of cells as in (H), measured by MTT assay; absorbance values were normalized to day 1.
Data from a representative of three independent experiments are presented as mean ± SD.
mean_S8K_d1 <- figure_S8K_data %>%
  filter(day == "d1") %>%
  group_by(Cell_line, Sample, Treatment, day) %>%
  summarise_all(mean) %>%
  dplyr::select(-day) %>%
  dplyr::rename(d1_mean = value)

figure_S8K_data_norm <- full_join(figure_S8K_data, mean_S8K_d1,
                             by = c("Cell_line","Sample", "Treatment")) %>%
  mutate(value_norm = value/d1_mean,
         Sample_treatment = paste(Sample, Treatment, sep = " "))

figure_S8k <- figure_S8K_data_norm %>%
  ggline(x = "day", y = "value_norm",
         add = c("mean_sd", "jitter"),
         facet.by = "Cell_line",
         ylab = "Cell growth (A.U.)",
         add.params =list(size = 1),
         color = "Sample_treatment",
         palette = "Paired",
         legend = "right")

# figure_S8K_data_norm %>%
#   filter("Cell_line" == "h543" & Sample == "shGFP") %>%
#   aov(value_norm ~ Treatment * day, data = .) %>%
#   summary()

figure_S8k
Cell growth of cells as in (J), measured by MTT assay; absorbance values were normalized to day 1.
Data from a representative of two independent experiments are presented as mean ± SD (n = 10, technical replicates).
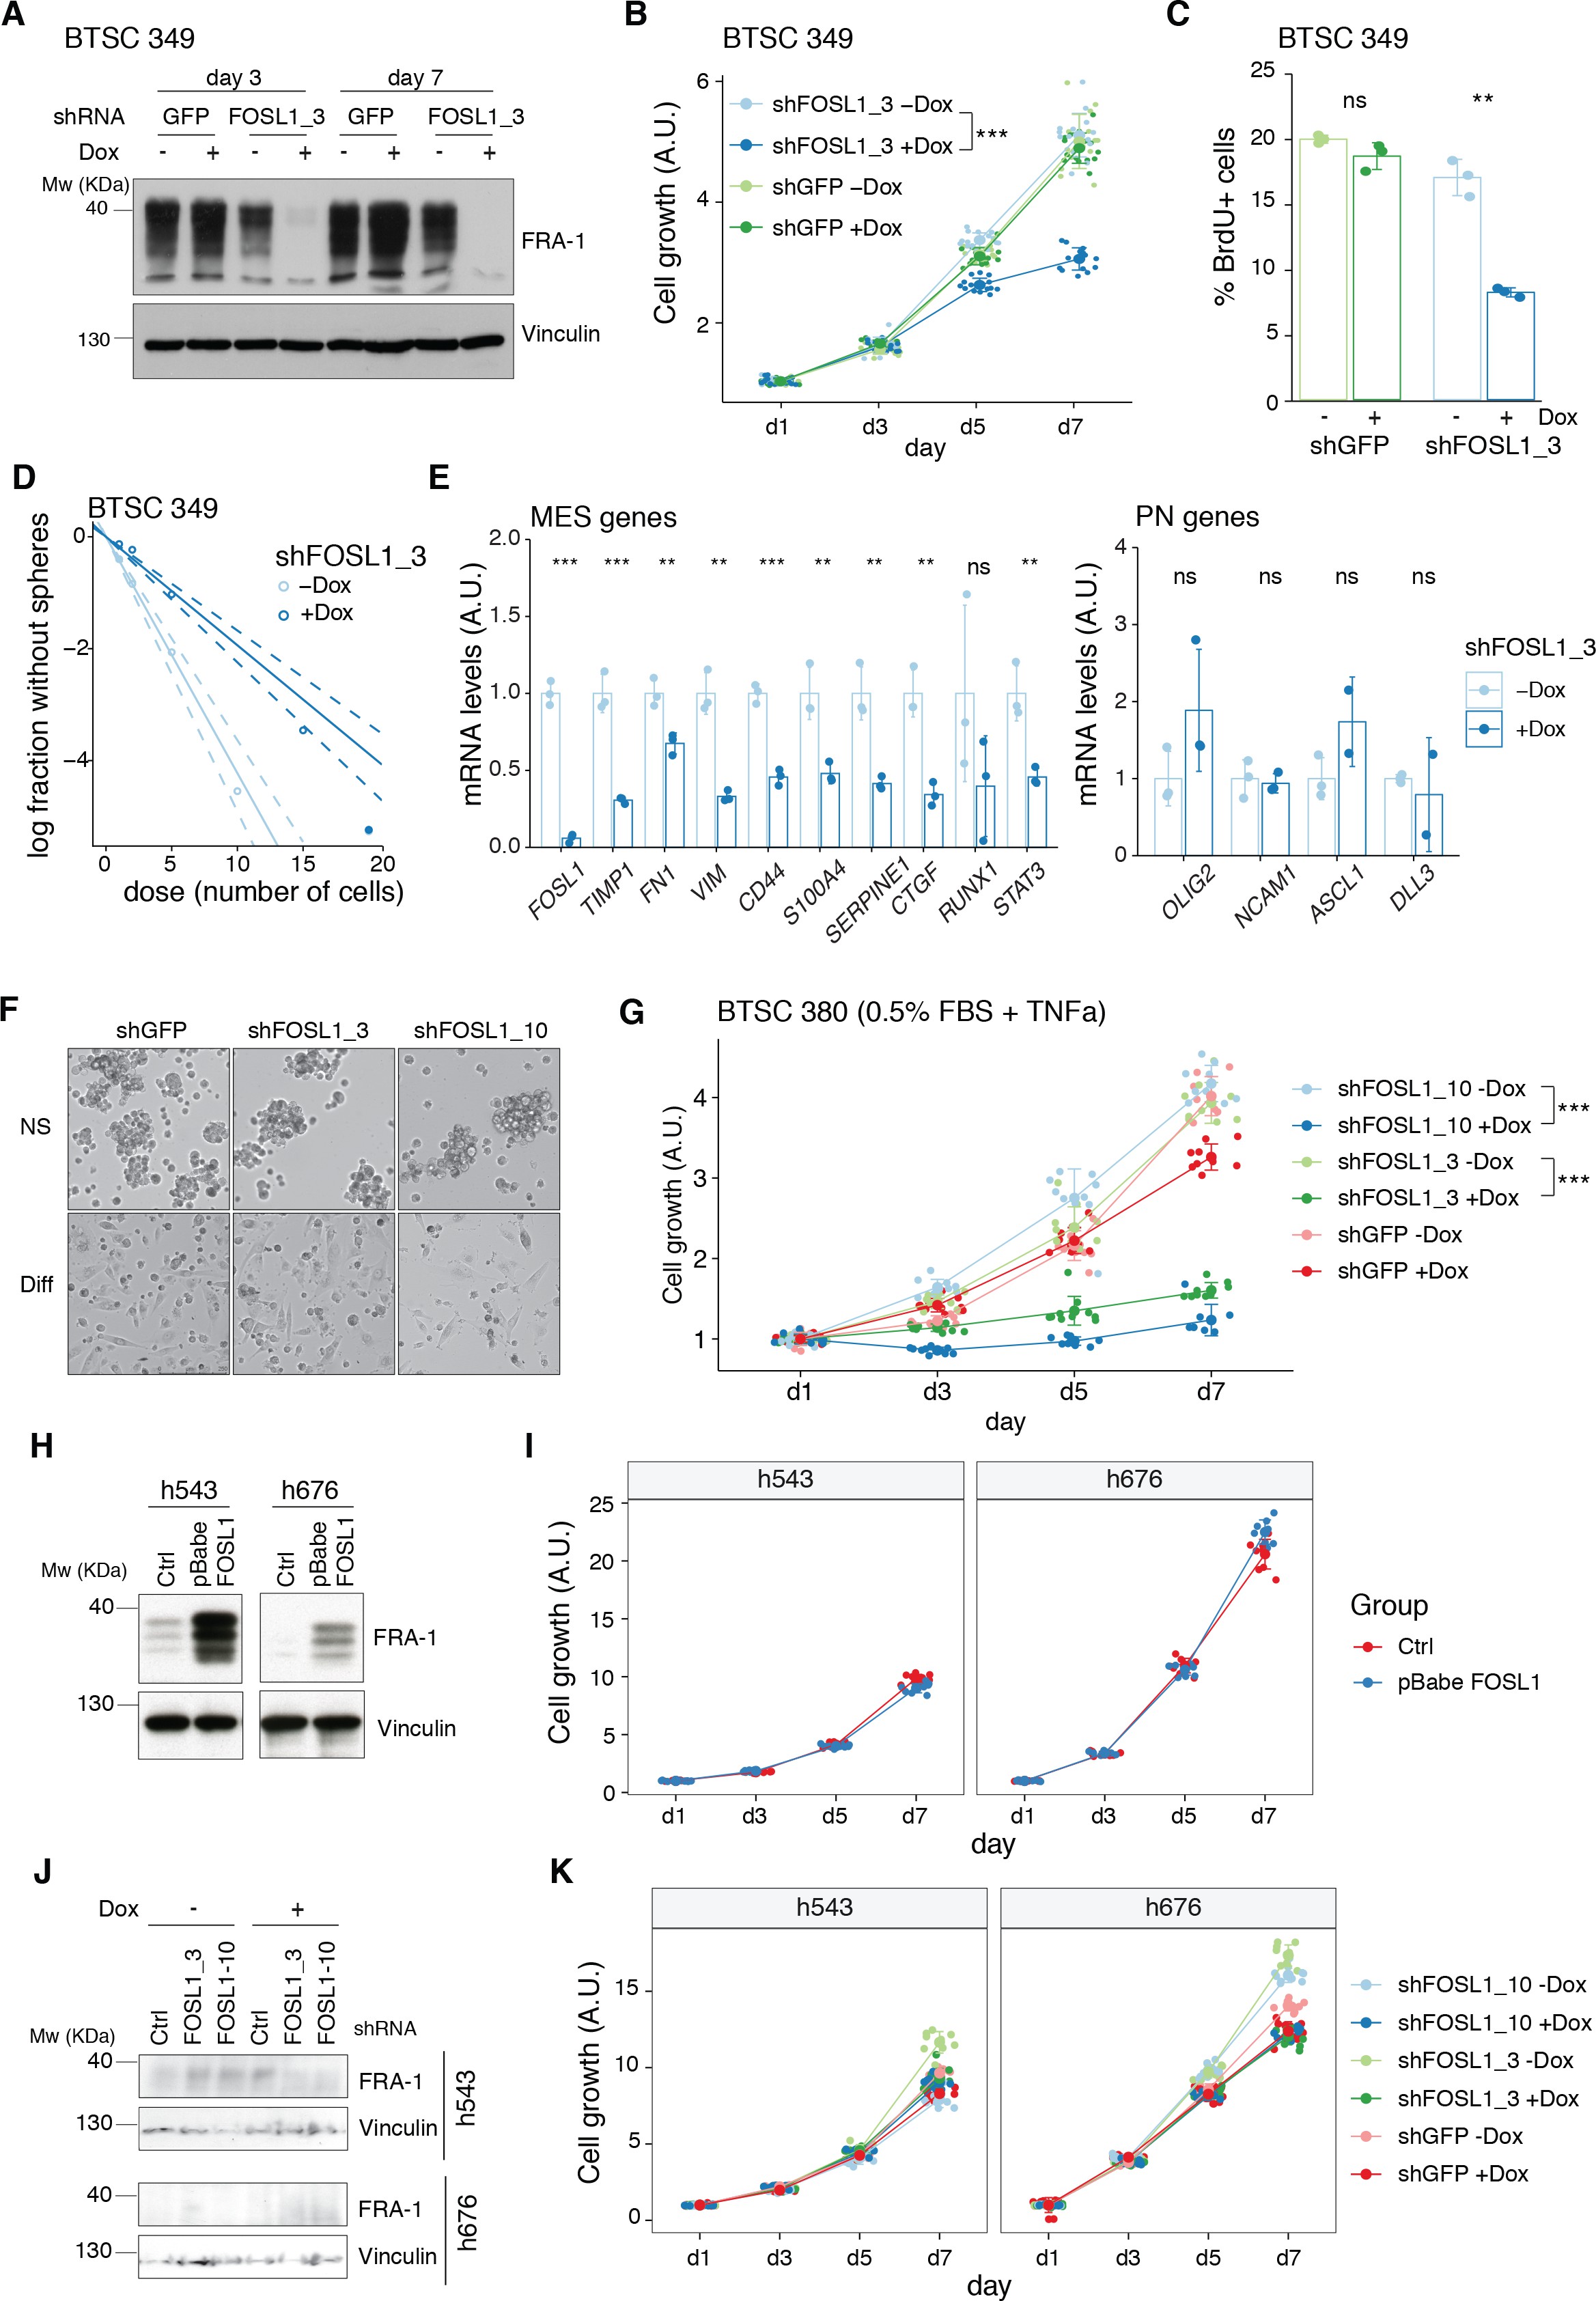
Further characterization of FOSL1 role in human brain tumor stem cells (BTSCs).
(A) Western blot detection of FRA-1 in BTSC 349 upon transduction with inducible shGFP (control) or shFOSL1_3, analyzed after 3 and 7 days of doxycycline (Dox) treatment; vinculin was used as loading control. (B) Cell growth of BTSC 349 shGFP and shFOSL1_3 cells, in the absence or presence of Dox, measured by MTT assay; absorbance values were normalized to day 1. Data from a representative of three independent experiments are presented as mean ± SD (n = 15, technical replicates). Student’s t test on day 7, relative to shFOSL1_3 –Dox: ***p≤0.001. (C) BrdU incorporation of BTSC 349 shGFP and shFOSL1_3, in the absence or presence of Dox, analyzed by flow cytometry. Data from a representative of two independent experiments are presented as mean ± SD (n = 3). Student’s t test, relative to the respective control (–Dox): ns = not significant, **p≤0.01. (D) Representative limiting dilution analysis on BTSC 349 shFOSL1_3 in the presence or absence of Dox, calculated with extreme limiting dilution assay (ELDA) analysis; p<0.0001. (E) mRNA expression of FOSL1, MES, and PN genes in BTSC 349 shFOSL1_3 cells in the absence or presence of Dox for 3 days. Data from a representative of three experiments are presented as mean ± SD (n = 3, technical replicates), normalized to GAPDH expression. Student’s t test, relative to –Dox: ns = not significant, *p≤0.05, **p≤0.01, ***p≤0.001. (F) Representative images of BTSC 380 grown in either neurosphere medium (NS) or in differentiation conditions (NS + 0.5% FBS + TNFalpha 5 ng/mL) for 5 days. Scale bar = 250 μm. (G) Cell growth of BTSC 380 grown in differentiation conditions, in the absence or presence of Dox, measured by MTT assay; absorbance values were normalized to day 1. Data from a representative of two independent experiments are presented as mean ± SD (n = 10, technical replicates). (H) Western blot detection of FRA-1 in h543 and h676 upon transduction with pBabe (control) or pBabe-FOSL1; vinculin was used as loading control. (I) Cell growth of cells as in (H), measured by MTT assay; absorbance values were normalized to day 1. Data from a representative of three independent experiments are presented as mean ± SD. (J) Western blot detection of FRA-1 in h543 and h676 upon transduction with the indicated shRNA. To note that FRA-1 is barely detectable in h676 cells (see also panel H and Figure 1A). (K) Cell growth of cells as in (J), measured by MTT assay; absorbance values were normalized to day 1. Data from a representative of two independent experiments are presented as mean ± SD (n = 10, technical replicates).
To study the role of FOSL1 in the context of human BTSCs, its expression was modulated in the MES BTSC 380 using two Dox-inducible shRNAs (shFOSL1_3 and shFOSL1_10). We confirmed by western blot FRA-1 downregulation after 3 and 7 days of Dox treatment (Figure 7B). In line to what was observed in mouse glioma-initiating cells, FOSL1 silencing in MES BTSC 380 resulted in reduced cell growth (Figure 7C) with a significant reduction of the percentage of BrdU positive cells compared to Dox-untreated cells (Figure 7D). Moreover, FOSL1 silencing decreased the sphere-forming capacity of MES BTSC 380 with an estimated stem cell frequency of shGFP –Dox = 3.5, shGFP +Dox = 3.4, chi-square p=0.8457; shFOSL1_3 –Dox = 4.3, shFOSL1_3 +Dox = 7.6, chi-square p=0.0002195; shFOSL1_10 –Dox = 5.4, shFOSL1_10 +Dox = 11.1, chi-square p=5.918e-06 (Figure 7E). Comparable results were also obtained in the MES BTSC 349 cells (Figure 7—figure supplement 1A–D). In line with our mouse experiments, FOSL1 silencing resulted in the significant downregulation of the MES genes (Figure 7—figure supplement 1E, left panel), whereas proneural gene expression was unchanged (Figure 7—figure supplement 1E, right panel). Of note, FOSL1 silencing affected BTSCs fitness also when propagated in differentiation conditions (Figure 7—figure supplement 1F, G).
Similar to what was observed in mouse tumors (Figure 6—figure supplement 1B), FOSL1 overexpression in two non-MES lines (h543 and h676) did not lead to changes in their proliferation capacity (Figure 7—figure supplement 1H, I). Most importantly, FOSL1 silencing in these non-MES lines had no impact on cell growth (Figure 7—figure supplement 1J, K), underscoring a mesenchymal context-dependent role for FOSL1 in glioma cells.
We then tested whether FOSL1/FRA-1 modulates the MGS via direct target regulation. To this end, we first identified high-confidence FOSL1/FRA-1 binding sites in chromatin immunoprecipitation-seq (ChIP-seq) previously generated in the KRAS mutant HCT116 colorectal cancer cell line (see Materials and methods), and then we determined the counts per million reads (CPM) of the enhancer histone mark H3K27Ac in a set of MES (n = 10) and non-MES BTSCs (n = 10) 53Mack et al.2019, selected based on the highest and lowest FOSL1 expression, respectively. PCA showed a marked separation of the two groups of BTSCs (Figure 7F). Differential enrichment analysis by DESeq2 revealed 11748 regions statistically significant (FDR < 0.005) for H3K27Ac at FOSL1/FRA-1 binding sites in either MES or non-MES BTSCs (Figure 7G). Next, we compared H3K27Ac distribution over FOSL1/FRA-1 binding sites to that of the non-MES MR OLIG2. This analysis showed that FOSL1/FRA-1 binding sites were systematically decorated with H3K27Ac in MES BTSCs, while the inverse trend was observed at OLIG2 binding sites (Figure 7H, I). Validation by ChIP-qPCR in an independent MES BTSC line (BTSC 349) confirmed FRA-1 direct binding at promoters of some MES genes including PLAU, TNC, ITGA5, and CD44 in GBM cells (Figure 7J).
Altogether, our data support that FOSL1/FRA-1 regulates MES gene expression and aggressiveness in human gliomas via direct transcriptional regulation, downstream of the NF1-MAPK-FOSL1 signaling.
Discussion
The most broadly accepted transcriptional classification of GBM was originally based on gene expression profiles of bulk tumors 85Verhaak et al.2010, which did not discriminate the contribution of tumor cells and TME to the transcriptional signatures. It is now becoming evident that both cell-intrinsic and -extrinsic cues can contribute to the specification of the MES subtype 10Bhat et al.201341Hara et al.202160Neftel et al.201971Schmitt et al.202187Wang et al.2017. Bhat and colleagues had shown that while some of the MES GBMs maintained the mesenchymal characteristics when expanded in vitro as BTSCs, some others lost the MGS after few passages while exhibiting a higher non-MGSs 10Bhat et al.2013. These data, together with the evidence that xenografts into immunocompromised mice of BTSCs derived from MES GBMs were also unable to fully restore the MES phenotype 10Bhat et al.2013, suggested that the presence of an intact TME potentially contributed to the maintenance of a MGS. In support of this, Schmitt and colleagues have recently shown that innate immune cells divert GBM cells to a proneural-to-mesenchymal transition (PN-to-MES) that also contributes to therapeutic resistance 71Schmitt et al.2021.
The transcriptional GBM subtypes were lately redefined based on the expression of glioma-intrinsic genes, thus excluding the genes expressed by cells of the TME 67Richards et al.202187Wang et al.2017. Our MRA on the BTSCs points to the AP-1 family member FOSL1 as one pioneer TF contributing to the cell-intrinsic MGS. Previous tumor bulk analysis identified a related AP-1 family member FOSL2, together with CEBPB, STAT3, and TAZ, as important regulators of the MES GBM subtype 9Bhat et al.201115Carro et al.2010. While FOSL1 was also listed as a putative MES MR 15Carro et al.2010, its function and mechanism of action have not been further characterized since then. Our experimental data show that FOSL1 is a key regulator of GBM subtype plasticity and MES transition, and define the molecular mechanism through which FOSL1 is regulated. While here we have focused on the TFs contributing to MES specifications, previous studies had highlighted the role of other TFs, some of which were also identified in our MRA, such as OLIG2, SALL2, and ASCL1, as important molecules for non-MES GBM cells 76Suvà et al.2014. Moreover, using a similar MRA, Wu and colleagues have recently described also SOX10 as another TF that contributes to the identity of non-MES GBM cells. Strikingly, loss of SOX10 resulted in MES transition associated with changes in chromatin accessibility in regions that are specifically enriched for FRA-1 binding motifs 90Wu et al.2020. Lastly, using an unbiased CRISPR/Cas9 genome-wide screening, Richards and colleagues had shown that few of the top TFs identified here, such as FOSL1, OLIG2, and ASCL1, are genes essential specifically either for MES GSCs (FOSL1) or for non-MES GSCs (OLIG2 and ASCL1) 67Richards et al.2021. This evidence further strengthen the relevance of the MRA that we have performed in the identification of important regulators of GBM subtype-specific cell biology.
Although consistently defined, GBM subtypes do not represent static entities. The plasticity between subtypes happens at several levels. Besides the referred MES-to-PN change in cultured GSCs compared to the parental tumor 10Bhat et al.2013, a PN-to-MES shift often occurs upon treatment and recurrence. Several independent studies comparing matched pairs of primary and recurrent tumors demonstrated a tendency to shift towards a MES phenotype, associated with a worse patient survival, likely as a result of treatment-induced changes in the tumor and/or the microenvironment 64Phillips et al.200683Varn et al.202186Wang et al.201687Wang et al.2017. Moreover, distinct subtypes/cellular states can coexist within the same tumor 60Neftel et al.201963Patel et al.201467Richards et al.202173Sottoriva et al.201383Varn et al.202188Wang et al.2019 and targeting these multiple cellular components could result in more effective treatments 88Wang et al.2019.
PN-to-MES transition is often considered an EMT-like phenomenon, associated with tumor progression 29Fedele et al.2019. The role of FOSL1 in EMT has been studied in other tumor types. In breast cancer cells, FOSL1 expression correlates with mesenchymal features and drives cancer stem cells 77Tam et al.2013 and the regulation of EMT seems to happen through the direct binding of FRA-1 to promoters of EMT genes such as Tgfb1, Zeb1, and Zeb204Bakiri et al.2015. In colorectal cancer cells, FOSL1 was also shown to promote cancer aggressiveness through EMT by direct transcription regulation of EMT-related genes 24Diesch et al.201450Liu et al.2015.
It is well established that NF1 inactivation is a major genetic event associated with the MES subtype 85Verhaak et al.201087Wang et al.2017. However, this is probably a late event in MES gliomagenesis as all tumors possibly arise from a PN precursor and just later in disease progression acquire NF1 alterations that are directly associated with a transition to a MES subtype 62Ozawa et al.2014. Moreover, NF1 deficiency has been linked to macrophage/microglia infiltration in the MES subtype 87Wang et al.2017. The fact that the enriched macrophage/microglia microenvironment is also able to modulate a MES phenotype suggests that there might be a two-way interaction between tumor cells and TME. The mechanisms of NF1-regulated chemotaxis and whether this relationship between the TME and MGS in GBM is causal remain elusive.
Here, we provide evidence that manipulation of NF1 expression levels in patient-derived BTSCs has a direct consequence on the tumor-intrinsic MGS activation and that such activation can at least in part be mediated by the modulation of FOSL1. Among the previously validated MRs, only CEBPB appears also to be finely tuned by NF1 inactivation. This suggests that among the TFs previously characterized (such as FOSL2, STAT3, BHLHB2, and RUNX1), FOSL1 and CEBPB might play a dominant role in the NF1-mediated MES transition that occurs in a glioma cell-intrinsic manner. However, whether FOSL1 contributes also to the cross-talk between the TME and the cell-intrinsic MGS still has to be established.
Furthermore, we show that FOSL1 is a crucial player in glioma pathogenesis, particularly in a MAPK-driven MES GBM context (Figure 8). Most likely, the existence of a NF1-MAPK-FOSL1 axis goes beyond GBM pathogenesis since FOSL1 appears to be upregulated in concomitance with NF1 mutations in multiple tumor types (Figure 8—figure supplement 1). Our findings broaden its previously described role in KRAS-driven epithelial tumors, such as lung and pancreatic ductal adenocarcinoma 82Vallejo et al.2017. NF1 inactivation results in Ras activation, which stimulates downstream pathways as MAPK and PI3K/Akt/mTOR. RAS/MEK/ERK signaling in turn regulates FRA-1 protein stability 16Casalino et al.200384Verde et al.2007. FOSL1 mRNA expression is then most likely induced by binding of the SRF/Elk1 complex to the serum-responsive element (SRE) on FOSL1 promoter 27Esnault et al.2017. At the same time, FRA-1 can then directly bind to its own promoter to activate its own expression 24Diesch et al.201448Lau et al.2016 and those of MES genes. This further generates a feedback loop that induces MGS, increases proliferation and stemness, sustaining tumor growth. FRA-1 requires, for its transcriptional activity, heterodimerization with the AP-1 TFs JUN, JUNB, or JUND 26Eferl and Wagner2003. Which of the JUN family members participate in the MES gene regulation and whether FOSL1/FRA-1 activates MES gene expression and simultaneously represses non-MES genes requires further investigation. Of note, pancancer analysis of anatomically distinct solid tumors suggested that c-JUN/JUNB and FOSL1/2 are bona fide canonical AP-1 TF configurations in mesenchymal states of lung, kidney, and stomach cancers 72Serresi et al.2021. Intriguingly, in support of a direct role in the repression of non-MES genes in GBM cells, it has been hypothesized, though not formally demonstrated, that FOSL1/FRA-1 could act as a transcriptional repressor of a core set of neurodevelopmental TFs, including OLIG2 and SALL2030Fiscon et al.2018.
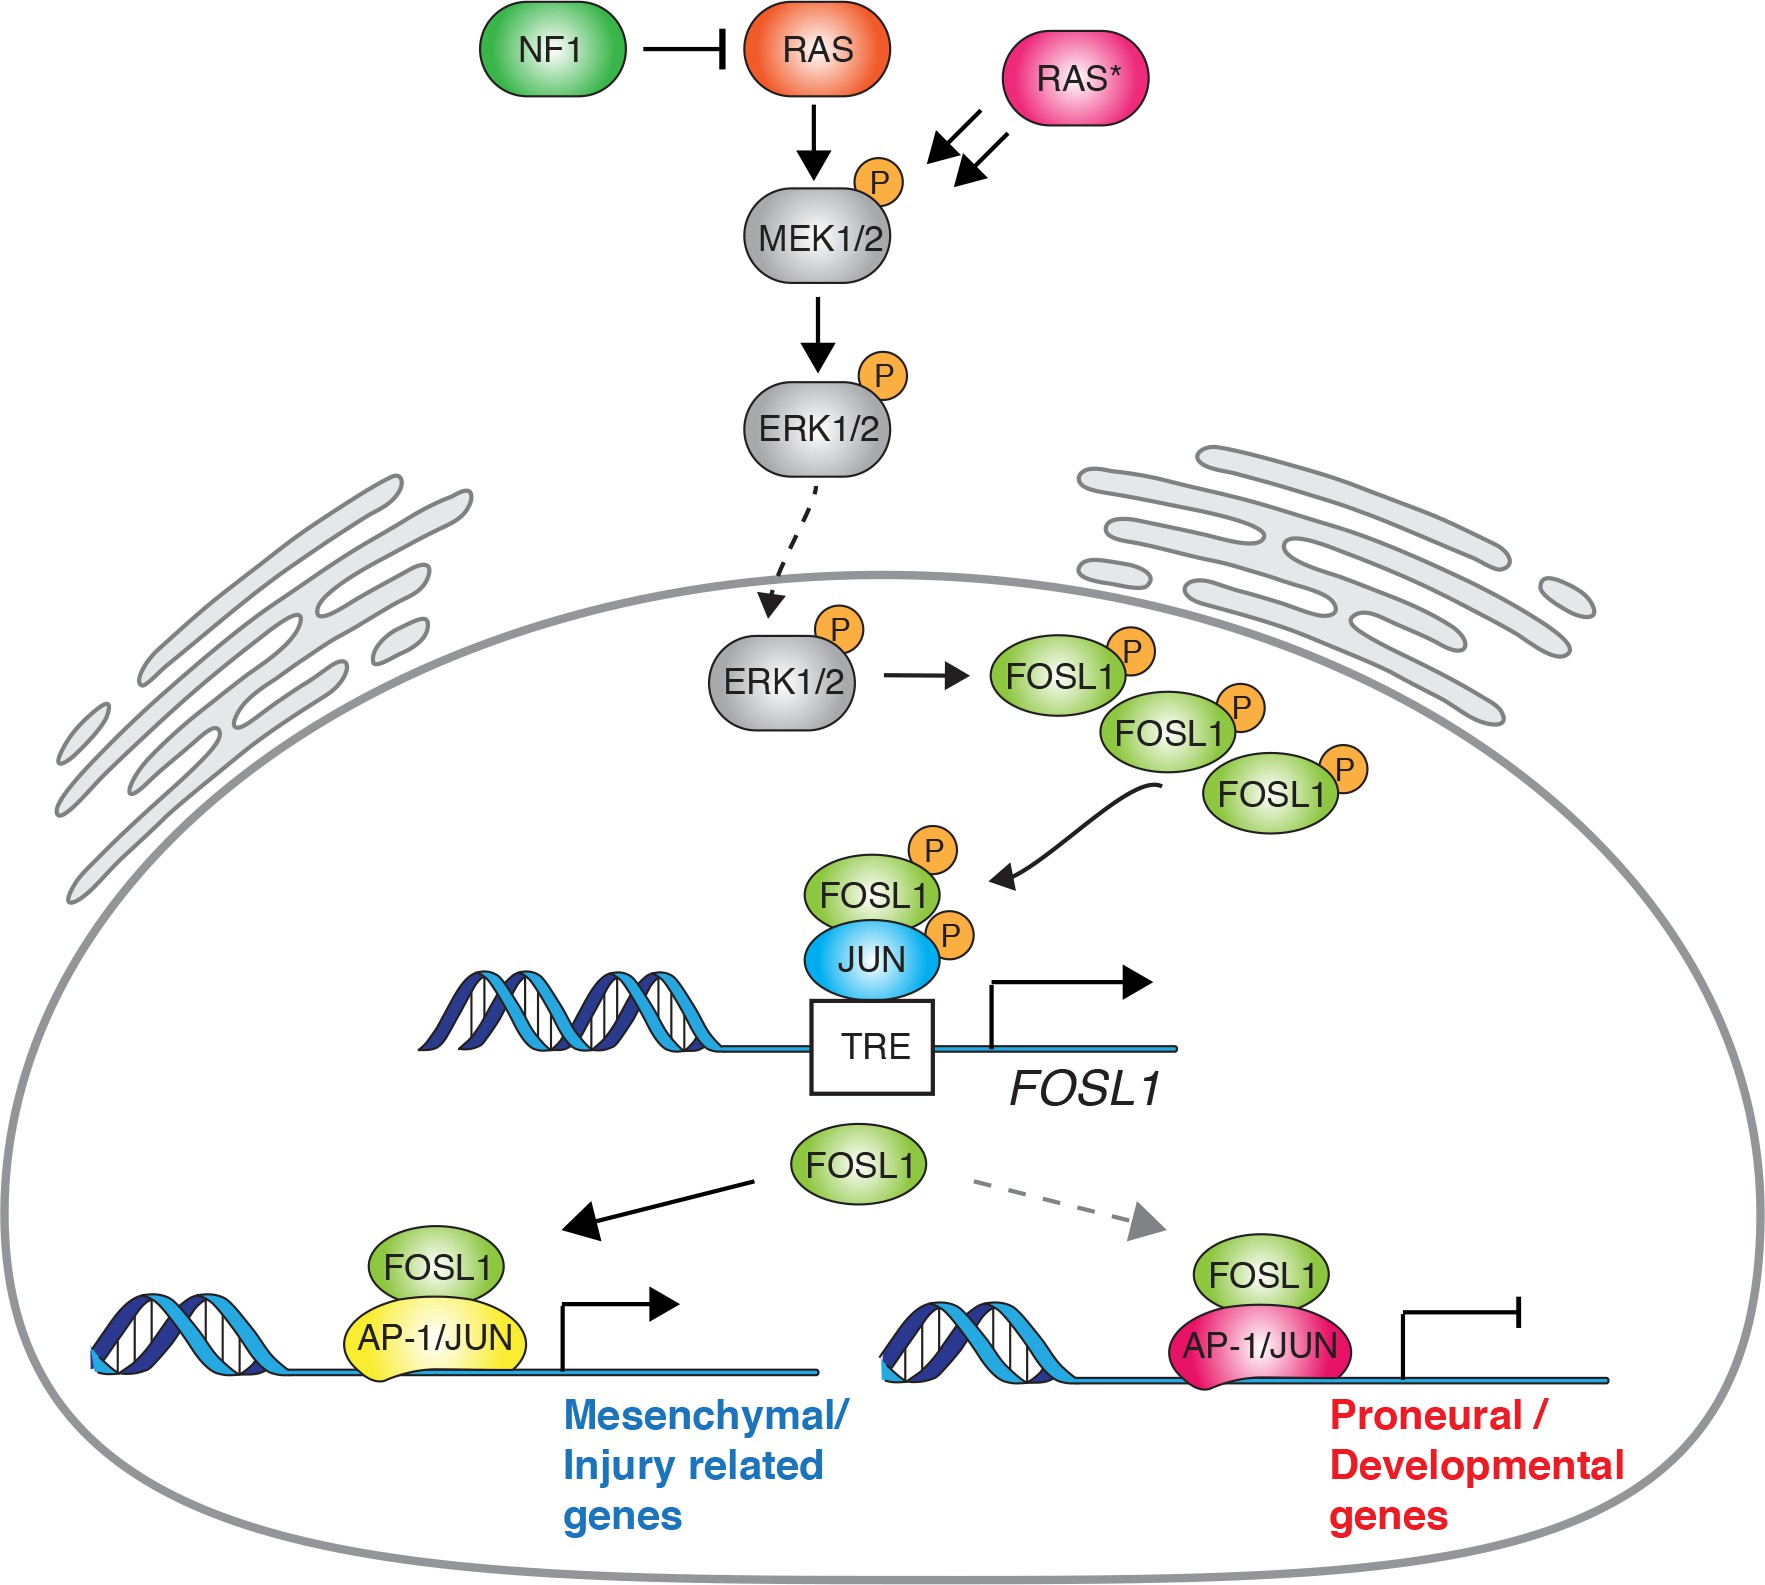
Schematic model of NF1-MAPK-FOSL1 axis in mesenchymal (MES) gliomas.
NF1 alterations or RAS mutations lead to the activation of the MAPK signaling that in turn increases FOSL1 expression both at the mRNA and protein levels. FOSL1 then activates the expression of the MES gene signature and possibly inhibits the non-MES gene signature. The scheme integrates data presented in this work as well as previously published literature on the regulation of FOSL1 expression by MAPK activation.
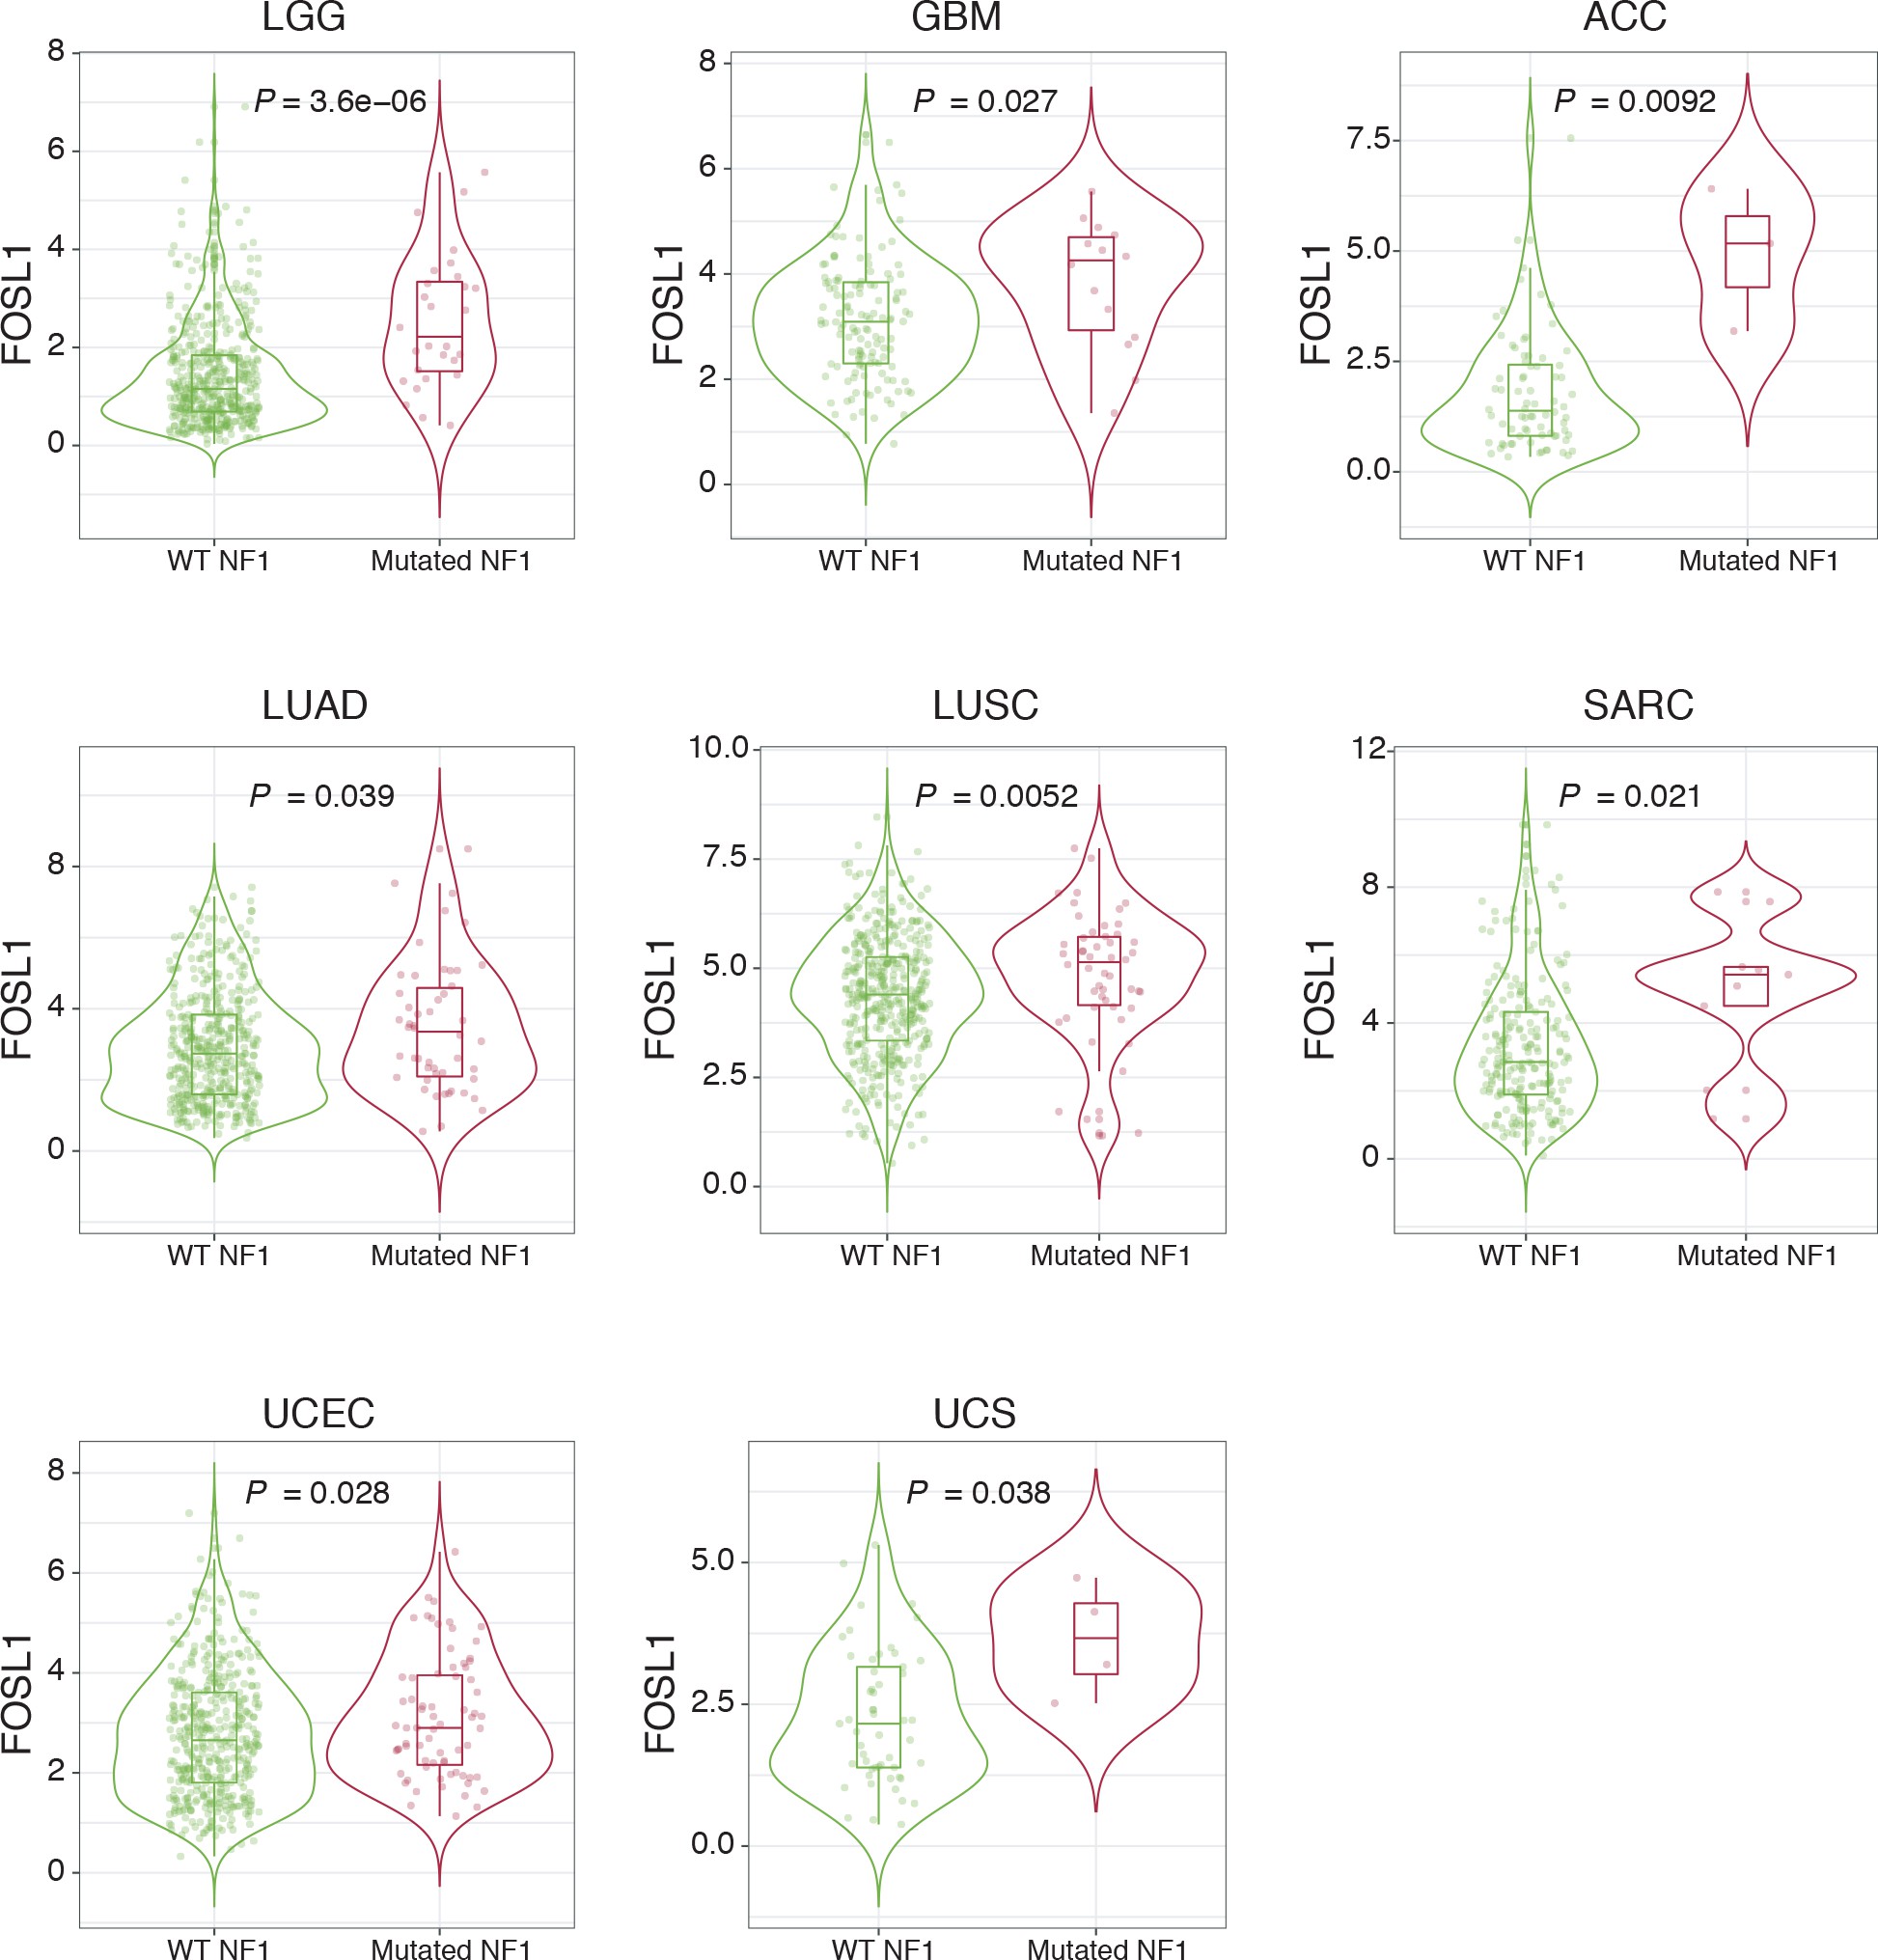
NF1 mutations are associated with higher FOSL1 expression in multiple cancer types.
FOSL1 mRNA expression in the indicated tumors of the TCGA, stratified according to NF1 mutational status. LGG: low-grade glioma; GBM: glioblastoma; ACC: adrenocortical carcinoma; LUAD: lung adenocarcinoma; LUSC: lung squamous cell carcinoma; SARC: sarcoma; UCEC: uterine corpus endometrial carcinoma; UCS: uterine carcinosarcoma. Wilcoxon p-values are indicated.
In conclusion, _FOSL1/_FRA-1 is a key regulator of the MES subtype of GBM, significantly contributing to its stem cell features, which could open new therapeutic options. Although _FOSL1/_FRA-1 pharmacological inhibition is difficult to achieve due to its enzymatic activity, a gene therapy approach targeting _FOSL1/_FRA-1 expression through CRISPR/Cas9 or PROTAC, for instance, could constitute attractive alternatives to treat mesenchymal GBM patients.
Materials and methods
| Reagent type (species) or resource | Designation | Source or reference | Identifiers | Additional information |
|---|---|---|---|---|
| Antibody | Anti-FRA-1 (Rabbit polyclonal) | Santa Cruz Biotechnology | Cat#sc-183; RRID:AB_2106928 | WB(1:1000) |
| Antibody | Anti-FRA-1 (Rabbit polyclonal) | Santa Cruz Biotechnology | Cat#sc-605, RRID:AB_2106927 | WB(1:1000) |
| Antibody | anti-CD44 (Rat monoclonal) | BD Biosciences | Cat#550538; RRID:AB_393732 | IF(1:100) |
| Antibody | Anti-S100A4 (Rabbit polyclonal) | Abcam | Cat#ab27957, RRID:AB_2183775 | IHC(1:300) |
| Antibody | Anti-Ki67 (Rabbit monoclonal) | Master Diagnostica | Cat#000310QD | IHC(undiluted) |
| Antibody | Anti-FLAG (DYKDDDDK Tag) (Rabbit polyclonal) | Cell Signaling Technology | Cat#2368, RRID:AB_2217020 | WB(1:2000) |
| Antibody | Anti-GFAP (Mouse monoclonal) | Sigma-Aldrich | Cat#G3893, RRID:AB_477010 | WB(1:5000) |
| Antibody | Anti-GFAP (Mouse monoclonal) | Millipore | Cat#MAB360, RRID:AB_11212597 | IF(1:400) |
| Antibody | Anti-NF1 (Rabbit polyclonal) | Santa Cruz Biotechnology | Cat#sc-67, RRID:AB_2149681 | WB(1:500) |
| Antibody | Anti-NF1 (Rabbit polyclonal) | Bethyl | Cat#A300-140A, RRID:AB_2149790 | WB(1:1000) |
| Antibody | Anti-OLIG2 (Rabbit polyclonal) | Millipore | Cat#AB9610, RRID:AB_570666 | WB(1:2000) |
| Antibody | Anti-VIMENTIN (Rabbit monoclonal) | Cell Signaling Technology | Cat#5741, RRID:AB_10695459 | WB(1:3000) |
| Antibody | Anti-phospho-p44/42 MAPK (Erk1/2) (Thr202/Tyr204) (Rabbit polyclonal) | Cell Signaling Technology | Cat#9101, RRID:AB_331646 | WB(1:2000) |
| Antibody | Anti-p44/42 MAPK (Erk1/2) (Rabbit polyclonal) | Cell Signaling Technology | Cat#9102, RRID:AB_330744 | WB(1:1000) |
| Antibody | Anti-phospho-MEK1/2 (Ser217/221) (Rabbit polyclonal) | Cell Signaling Technology | Cat#9154, RRID:AB_2138017 | WB(1:500) |
| Antibody | Anti-MEK1/2 (Rabbit polyclonal) | Cell Signaling Technology | Cat#9122, RRID:AB_823567 | WB(1:1000) |
| Antibody | Anti-human YKL40 (Rabbit polyclonal) | Qidel | Cat#4815, RRID:AB_452475 | WB(1:1000) |
| Antibody | Anti-PI3 kinase, p85 (Rabbit polyclonal) | Millipore | Cat#06-195, RRID:AB_310069 | WB(1:10,000) |
| Antibody | Anti-vinculin (Mouse monoclonal) | Sigma-Aldrich | Cat#V9131, RRID:AB_477629 | WB(1:10,000) |
| Antibody | Anti-α-tubulin (Mouse monoclonal) | Abcam | Cat#ab7291, RRID:AB_2241126 | WB(1:10,000) |
| Antibody | Biotinylated anti-rabbit IgG (Goat polyclonal) | Vector Laboratories | Cat#BA-1000, RRID:AB_2313606 | IHC(1:200) |
| Antibody | Anti-rat IgG (H+L) (goat unknown) | Vector Laboratories | Cat#BA-9400, RRID:AB_2336202 | IHC(1:200) |
| Antibody | Peroxidase-AffiniPure anti-mouse IgG (Goat polyclonal) | Jackson ImmunoResearch Labs | Cat#115-035-003, RRID:AB_10015289 | WB(1:10,000) |
| Antibody | Peroxidase-AffiniPure anti-rabbit IgG (Goat polyclonal) | Jackson ImmunoResearch Labs | Cat#111-035-003, RRID:AB_2313567 | WB(1:10,000) |
| Antibody | Alexa Fluor 488 anti-rabbit IgG (H+L) (Donkey polyclonal) | Thermo Fisher Scientific | Cat#A21206; RRID:AB_2535792 | IF(1:400) |
| Antibody | Alexa Fluor 488 anti-mouse IgG (H+L) (Donkey polyclonal) | Thermo Fisher Scientific | Cat#A21202; RRID:AB_141607 | IF(1:400) |
| Antibody | Alexa Fluor 594 anti-rat IgG (H+L) (Donkey polyclonal) | Thermo Fisher Scientific | Cat#A21209; RRID:AB_2535795 | IF(1:400) |
| Chemical compound, drug | Ovomucoid | Worthington | Cat#LS003087 | |
| Chemical compound, drug | N-acetyl-L-cysteine | Sigma-Aldrich | Cat#A9165 | |
| Peptide, recombinant protein | Recombinant human EGF | Gibco | Cat#PHG0313 | |
| Peptide, recombinant protein | Basic-FGF | Millipore | Cat#GF003-AF | |
| Peptide, recombinant protein | Heparin | Stem Cell Technologies | Cat#07980 | |
| Chemical compound, drug | L-glutamine | Hyclone | Cat#SH3003401 | |
| Chemical compound, drug | Accumax | Thermo Fisher Scientific | Cat#00-4666-56 | |
| Chemical compound, drug | Polybrene | Sigma-Aldrich | Cat#H9268 | |
| Chemical compound, drug | Puromycin | Sigma-Aldrich | Cat#P8833 | |
| Chemical compound, drug | Doxycycline | PanReac AppliChem | Cat#A29510025 | |
| Chemical compound, drug | Hydrogen peroxide | Sigma-Aldrich | Cat#H1009 | |
| Peptide, recombinant protein | BSA | Sigma-Aldrich | Cat#A7906 | |
| Chemical compound, drug | BrdU | Sigma-Aldrich | Cat#B9285 | |
| Chemical compound, drug | Peroxidase substrate DAB | Vector Laboratories | Cat#SK-4100 | |
| Chemical compound, drug | TRIzol | Invitrogen | Cat#15596-026 | |
| Chemical compound, drug | MTT | Sigma-Aldrich | Cat#M5655 | |
| Chemical compound, drug | PI | Sigma-Aldrich | Cat#P4170 | |
| Other | Goat serum | Sigma-Aldrich | Cat#G9023 | |
| Other | RNase A | Roche | Cat#10109142001 | |
| Other | DAPI | Sigma-Aldrich | Cat#D8417 | |
| Other | ProLong Gold Antifade | Invitrogen | Cat#P10144 | |
| Other | Protein A/G plus-agarose beads | Santa Cruz Biotechnology | Cat#sc-2003 | |
| Other | Salmon sperm DNA | Thermo Fisher Scientific | Cat#AM9680 | |
| Other | Neurobasal medium | Gibco | Cat#10888022 | |
| Other | B27 supplement | Gibco | Cat#12587010 | |
| Other | N2 supplement | Gibco | Cat#17502048 | |
| Other | Earl’s Balanced Salt Solution | Gibco | Cat#14155-08 | |
| Other | Papain | Worthington | Cat#LS003119 | |
| Other | DNaseI | Roche | Cat#10104159001 | |
| Other | Mouse NeuroCult basal medium | Stem Cell Technologies | Cat#05700 | |
| Other | Mouse NeuroCult Proliferation supplement | Stem Cell Technologies | Cat#05701 | |
| Other | ACK lysing buffer | Gibco | Cat#A1049201 | |
| Other | DMEM | Sigma-Aldrich | Cat#D5796 | |
| Commercial assay or kit | High Capacity cDNA Reverse Transcription Kit | Applied Biosystems | Cat#4368814 | |
| Commercial assay or kit | SYBR Select Master Mix | Applied Biosystems | Cat#4472908 | |
| Commercial assay or kit | SuperscriptIII reverse transcriptase | Life Technologies | Cat#18080-085 | |
| Commercial assay or kit | QuantSeq 3′ mRNA-Seq Library Prep Kit (FWD) for Illumina | Lexogen | Cat#015 | |
| Commercial assay or kit | StemPro Osteogenesis Differentiation Kit | Life Technologies | Cat#A1007201 | |
| Commercial assay or kit | Active Ras pull down assay kit | Thermo Fisher Scientific | Cat#16117 | |
| Commercial assay or kit | QIAquick PCR purification kit | QIAGEN | Cat#28104 | |
| Commercial assay or kit | QIAGEN PCR cloning kit | QIAGEN | Cat#231124 | |
| Recombinant DNA reagent | pCHMWS- NF1-GRD | This paper | N/A | NF1-GRD overexpressing construct generated in the Carro’s lab |
| Recombinant DNA reagent | pLKO-shNF1 | Sigma-Aldrich | TRCN0000238778 | |
| Recombinant DNA reagent | pGIPZ-shNF1 | This paper | N/A | Human NF1 shRNA construct generated in the Carro’s lab |
| Recombinant DNA reagent | pGIPZ-shNF1 clone V2LHS_76027 (clone 4) | Open Biosystems | RHS4430-98894408 | |
| Recombinant DNA reagent | pGIPZ-shNF1 clone V2LHS_260806 (clone 5) | Open Biosystems | RHS4430-98912463 | |
| Recombinant DNA reagent | pKLV-U6gRNA-PGKpuro2ABFP | Kosuke Yusa (Wellcome Sanger Institute) | Addgene plasmid #50946 | |
| Recombinant DNA reagent | pLVX-Cre | Maria A. Blasco (CNIO) | N/A | |
| Recombinant DNA reagent | pLKO.1-TET-shFOSL1_3 and shFOSL1_10 | Silve Vicent (CIMA) | N/A | |
| Recombinant DNA reagent | pMD2.G | Carro’s lab | Addgene plasmid #12259 | |
| Recombinant DNA reagent | psPAX2 | Carro’s lab | Addgene plasmid #12260 | |
| Recombinant DNA reagent | pBabe-FOSL1 | 57Matsuo et al.2000 | N/A | |
| Recombinant DNA reagent | pSIN-EF1-puro-FLAG-FOSL1 | Silve Vicent (CIMA) | N/A | |
| Recombinant DNA reagent | pSIN-EF1-puro-eGFP | Silve Vicent (CIMA) | N/A | |
| Recombinant DNA reagent | RCAS-sgNf1 | This paper | N/A | Mouse Nf1 sgRNA construct generated in the Squatrito’s lab |
| Recombinant DNA reagent | RCAS-shNf1 | 62Ozawa et al.2014 | N/A | |
| Recombinant DNA reagent | RCAS-KrasG12V | This paper | N/A | KRASG12V construct generated in the Squatrito’s lab |
| Software, algorithm | FlowJo v10 | BD (Becton, Dickinson and Company) | N/A | |
| Software, algorithm | RStudio | https://rstudio.com/products/rstudio/ | N/A | |
| Software, algorithm | Nextpresso RNA-Seq pipeline | 37Graña et al.2018 | https://hub.docker.com/r/osvaldogc/nextpresso | |
| Software, algorithm | deepTools2 | 65Ramírez et al.2016 | https://deeptools.readthedocs.io/en/develop/ | |
| Software, algorithm | bowtie2 v2.3.5 | 47Langmead and Salzberg2012 | Bowtie 2, RRID:SCR_016368 | |
| Software, algorithm | SeqMonk | https://www.bioinformatics.babraham.ac.uk/projects/seqmonk/ | SeqMonk, RRID:SCR_001913 | |
| Software, algorithm | ChaSE | 93Younesy et al.2016 | http://chase.cs.univie.ac.at/overview | |
| Software, algorithm | GSEA | 75Subramanian et al.2005 | Gene Set Enrichment Analysis, RRID:SCR_003199 | |
| Software, algorithm | R programming language | R Core team 2013 | R Project for Statistical Computing, RRID:SCR_001905 | |
| Software, algorithm | trim-galore v0.6.2 | https://www.bioinformatics.babraham.ac.uk/projects/trim_galore/ | N/A | |
| Cell line (Gallus gallus) | DF1 | ATCC | Cat#CRL-12203 | |
| Cell line (Homo sapiens) | Gp2-293 | Clontech | Cat#631458 | |
| Cell line (Homo sapiens) | BTSC 232 | 28Fedele et al.2017 | N/A | |
| Cell line (Homo sapiens) | BTSC 233, BTSC 3021, BTSC 3047, BTSC 349, BTSC 380 | This paper | N/A | Human patient-derived lines generated at Freiburg University; see Materials and methods for details |
| Cell line (Homo sapiens) | h543, h676 | 62Ozawa et al.2014 | N/A |
Generation of the BTSCs dataset and MRA
The BTSC lines dataset (n = 144) was assembled with new and previously generated transcriptomic data: 22 Illumina HumanHT-12v4 expression BeadChip microarrays newly generated at Freiburg University (GSE137310, this study), 44 RNA-seq samples (Illumina HiSeq 2500) from GSE119834 53Mack et al.2019, 14 RNA-seq samples (Illumina HiSeq 2000) from SRP057855 22Cusulin et al.2015, 30 Affymetrix Human Genome U219 microarrays from GSE67089 56Mao et al.2013, 17 Affymetrix Human Genome U133 Plus 2.0 microarrays from GSE8049 38Günther et al.2008, and 17 Affymetrix GeneChip Human Genome U133A 2.0 microarrays from GSE49161 10Bhat et al.2013. To analyze the RNA-seq samples, we used the Nextpresso pipeline 37Graña et al.2018. For the Affymetrix microarrays, raw data were downloaded from the GEO repository (https://www.ncbi.nlm.nih.gov/geo/) and subsequently the ‘affy’ R package 35Gautier et al.2004 was used for robust multi-array average normalization followed by quantile normalization. For genes with several probe sets, the median of all probes had been chosen and only common genes among all the datasets (n = 9889) were used for further analysis. To avoid issues with the use of different transcriptomic platforms, each dataset was then scaled (mean = 0, SD = 1) before assembling the combined final dataset. Transcriptional subtypes were obtained using the ‘ssgsea.GBM.classification’ R package 87Wang et al.2017, using 1000 permutations. For differential gene expression studies, we selected the 133 BTSCs lines that had concordant ssGSEA results, with MES BTSCs classified both as MES and INJ and non-MES BTSCs classified both as PN/CL and DEV. Differential gene expression (MES vs. non-MES BTSCs) was performed using the ‘limma’ R package 68Ritchie et al.2015, taking into account the possible batch differences due the different datasets assembled.
The MRA was performed using the ‘RTN’ R package 17Castro et al.2016. Normalized BTSC expression data were used as input to build a transcriptional network (TN) for 887 TFs present in the dataset. TF annotations were obtained from the human TF atlas version 1.0.1 (http://humantfs.ccbr.utoronto.ca/) 46Lambert et al.2018. p-Values for network edges were computed from a pooled null distribution using 1000 permutations. Edges with an adjusted-p-value<0.05 were kept for data processing inequality (DPI) filtering. In the TN, each target can be connected to multiple TFs and regulation can occur as a result of both direct and indirect interactions. DPI filtering removes the weakest interaction in any triangle of two TFs and a target gene, therefore preserving the dominant TF-target pairs and resulting in a filtered TN that highlights the most significant interactions 31Fletcher et al.2013. Post-DPI filtering, the MRA computes the overlap between the transcriptional regulatory unities (regulons) and the input signature genes using the hypergeometric distribution (with multiple hypothesis testing corrections). To identify MRs, the differential gene expression between MES and non-MES was used as a phenotype.
TCGA and CGGA data analysis
RSEM normalized RNA-seq data for the TCGA GBMLGG and CGGA datasets were downloaded from the Broad Institute Firebrowse (http://gdac.broadinstitute.org) and the Chinese Glioma Genome Atlas (updated November 2019) (http://www.cgga.org.cn/), respectively. NF1 copy number alterations and point mutations for the TCGA GBMLGG were obtained at the cBioPortal (https://www.cbioportal.org). FOSL1 expression and NF1 mutational status for the TCGA datasets in Figure 8—figure supplement 1 were obtained from the Timer2.0 web portal (http://timer.cistrome.org/) 49Li et al.2020. Transcriptional subtypes were inferred using the ‘ssgsea.GBM.classification’ R package as indicated above. Glioma molecular subtypes information was downloaded from the GlioVis web portal (http://gliovis.bioinfo.cnio.es) 11Bowman et al.2017. Survival analysis was performed using the ‘survival’ R package. Stratification of the patients has been done by comparing the patients with the 30% FOSL1 high expression to the 30% FOSL1 low expression.
scRNA-seq datasets
Preprocessed scRNA-seq data were downloaded from the Broad Institute Single-Cell Portal (https://singlecell.broadinstitute.org/single_cell/), study numbers SCP503 67Richards et al.2021 and SCP393 60Neftel et al.2019.
Gene expression array and GSEA
For gene expression profiling of the BTSC lines of the Freiburg dataset, total RNA was prepared using the RNeasy kit (QIAGEN #74104) or the AllPrep DNA/RNA/Protein mini kit (QIAGEN #80004) and quantified using 2100 Bioanalyzer (Agilent). One-and-a-half microgram of total RNA for each sample was sent to the genomic facility of the German Cancer Research Center (DKFZ) in Heidelberg (Germany), where hybridization and data normalization were performed. Hybridization was carried out on Illumina HumanHT-12v4 expression BeadChip. GSEA was performed using the GSEA software (http://www.broadinstitute.org/gsea/index.jsp) 75Subramanian et al.2005. Gene signatures are listed in Supplementary file 5.
ATAC-seq
ATAC-seq was performed on 60,000 p53-null KrasG12V mouse NSCs transduced with either sgFosl1_1, sgFosl1_3, or sgCtrl. Briefly, the cells were pelleted in PBS and tagmentation was performed in either 50 μL of master mix containing 25 μL 2xTD buffer, 2.5 μL transposase, and 22.5 μL nuclease-free water (Nextera DNA Library Prep, Illumina #FC-121-1030) or in 50 μL of tagmentation mix containing 25 μL of TAPS-DMF buffer (80 mM TAPS, 40 mM MgCl2, 50% vol/vol DMF), 0.625 μL in-house-produced hyperactive Tn5 enzyme and 24.4 μL nuclease-free water (adapted from 43Hennig et al.2018). The tagmentation reactions were incubated for 1 hr at 37°C with moderate agitation (500–800 rpm). After the incubation, 5 μL of Proteinase K (Invitrogen #AM2548) were added to the samples to stop the transposition. The cells were subsequently lysed by adding 50 μL of AL buffer (QIAGEN #19075) and incubating for 10 min at 56°C. The DNA was extracted by means of 1.8× vol/vol AMPure XP beads (Beckman Coulter #A63881) and eluted in 18 μL. To determine the optimal number of PCR cycles required for library amplification, 2 μL of each sample were taken as template for qPCR using KAPA HiFi HotStart ReadyMix (Roche #7958927001) and 1xEvaGreen Dye (Biotium #31000). The whole probe amplification was performed in 50 μL qPCR volume with 8–12 μL of template DNA. Primers were previously described 13Buenrostro et al.2013. Each library was individually quantified utilizing the Qubit 3.0 Fluorometer (Life Technologies). The appropriate ATAC-seq libraries laddering pattern was determined with TapeStation High Sensitivity D1000 ScreenTapes (Agilent #5067-5584). The libraries were sequenced on the Illumina NextSeq500 using the High Output V2 150 cycles chemistry kit in a 2 × 75 bp mode.
ATAC-seq analysis
The reads were adaptor-trimmed using the trim-galore v0.6.2 --nextera (https://www.bioinformatics.babraham.ac.uk/projects/trim_galore/). The mapping was conducted using the bowtie2 v2.3.5 47Langmead and Salzberg2012 default parameters. The differential chromatin accessibility analysis was performed in SeqMonk taking mouse CpG islands (mCGI) and TSSs ± 500 bp as the probe set (GRCm38 assembly). Counts were normalized by means of the ‘Read Count Quantification’ function with additional correction for total count (CPM), log transformation, and size factor normalization. The differential accessibility between the Fosl1-WT and Fosl1-depleted cells was determined utilizing the limma pipeline 68Ritchie et al.2015.
The ‘chromVAR’ R package 70Schep et al.2017 was used to analyze the chromatin accessibility data, perform corrections for known technical biases, and identify motifs with differential deviation in chromatin accessibility between the samples. The enrichGO function from the ‘clusterProfiler’ R package 94Yu et al.2012 was used to visualize the relevant pathways in Figure 4D, E. The bamCoverage function of the deepTools2 tool 65Ramírez et al.2016 was used to generate BigWig from aligned files for subsequent visualization with the ‘karyoploteR’ R package 36Gel and Serra2017.
ChIP-seq analysis
We downloaded FOSL1 ChIP-seq profiling from the KRAS mutant HCT116 cell line ENCODE tracks ENCFF000OZR and ENCFF000OZQ. FOSL1/FRA-1 peaks (29,738) were identified with SeqMonk using the MACS algorithm 95Zhang et al.2008 with a 10−7p-value cutoff. OLIG2 binding sites and ChIP-seq profiles were downloaded from GEO: GSM1306365_MGG8TPC.OLIG2r1c and GSM1306367_MGG8TPC.OLIG2r2 76Suvà et al.2014. H3K27Ac data were downloaded from GSE119755 53Mack et al.2019 for GSM3382275_GSC1_H3K27AC, GSM3382277_GSC10_H3K27AC, GSM3382285_GSC14_H3K27AC, GSM3382289_GSC16_H3K27AC, GSM3382291_GSC17_H3K27AC, GSM3382293_GSC18_H3K27AC, GSM3382295_GSC19_H3K27AC, GSM3382299_GSC20_H3K27AC, GSM3382303_GSC22_H3K27AC, GSM3382313_GSC27_H3K27AC, GSM3382319_GSC3_H3K27AC, GSM3382327_GSC33_H3K27AC, GSM3382331_GSC35_H3K27AC, GSM3382333_GSC36_H3K27AC, GSM3382341_GSC4_H3K27AC, GSM3382343_GSC40_H3K27AC, GSM3382345_GSC41_H3K27AC, GSM3382347_GSC43_H3K27AC, GSM3382351_GSC5_H3K27AC, GSM3382355_GSC7_H3K27AC. Quantitation was Read Count Quantitation using all reads correcting for total count only in probes normalized to the largest store, log transformed, and duplicates ignored. Differential H3K27Ac signal was measured through the DESeq2 pipeline 52Love et al.2014. Heatmaps were generated with ChaSE 93Younesy et al.2016, plotting H3K27AC signal over FOSL1 (3532 probes, MES vs. non-MES log2 fold-change >2) or OLIG2 (15800 probes) peaks, with a 10,000 bp probe window.
Mouse strains and husbandry
GFAP-tv-a; hGFAP-Cre; Rosa26-LSL-Cas9 mice were previously described 61Oldrini et al.2018. KrasLSLG12V; Trp53lox; Rosa26LSLrtTA-IRES-EGFP; Col1a1TetO-Fosl1 mouse strain corresponds to the MGI Allele References 3582830, 1931011, 3583817, and 5585716, respectively. Immunodeficient nu/nu mice (MGI: 1856108) were obtained at the Spanish National Cancer Research Centre Animal Facility.
Mice were housed in the specific pathogen-free animal house of the Spanish National Cancer Research Centre under conditions in accordance with the recommendations of the Federation of European Laboratory Animal Science Associations (FELASA). All animal experiments were approved by the Ethical Committee (CEIyBA) (# CBA 31_2019-V2) and performed in accordance with the guidelines stated in the International Guiding Principles for Biomedical Research Involving Animals, developed by the Council for International Organizations of Medical Sciences (CIOMS).
Cell lines, cell culture, and drug treatments
Mouse NSCs were derived from the whole brain of newborn mice of Gtv-a; hGFAP-Cre; LSL-Cas9; Trp53lox (referred to as p53-null NSCs) and KrasLSLG12V; Trp53lox; Rosa26LSLrtTA-IRES-EGFP; Col1a1TetO-Fosl1 (referred to as Fosl1TetON NSCs). Tumorsphere lines were derived from tumors of C57BL/6J injected with Fosl1TetON NSCs when mice were sacrificed after showing symptoms of brain tumor disease. For the derivation of mouse NSCs and tumorspheres, tissue was enzymatically digested with 5 mL of papain digestion solution (0.94 mg/mL papain [Worthington #LS003119], 0.48 mM EDTA, 0.18 mg/mL N-acetyl-L-cysteine [Sigma-Aldrich #A9165] in Earl’s Balanced Salt Solution [Gibco #14155-08]) and incubated at 37°C for 8 min. After digestion, the enzyme was inactivated by the addition of 2 mL of 0.71 mg/mL ovomucoid (Worthington #LS003087) and 0.06 mg/mL DNaseI (Roche #10104159001) diluted in Mouse NeuroCult basal medium (Stem Cell Technologies #05700) without growth factors. Cell suspension was centrifuged at a low speed and then passed through a 40 μm mesh filter to remove undigested tissue, washed first with PBS and then with ACK lysing buffer (Gibco #A1049201) to remove red blood cells. NSCs and tumorspheres were grown in Mouse NeuroCult basal medium, supplemented with Proliferation supplement (Stem Cell Technologies #05701), 20 ng/mL recombinant human EGF (Gibco #PHG0313), 10 ng/mL basic-FGF (Millipore #GF003-AF), 2 µg/mL heparin (Stem Cell Technologies #07980), and L-glutamine (2 mM, Hyclone #SH3003401). Spheres were dissociated with Accumax (Thermo Fisher Scientific #00-4666-56) and re-plated every 4–5 days.
Patient-derived GBM stem cells (BTSCs) from Freiburg University were prepared from tumor specimens under IRB-approved guidelines (#407/09_120965) as described before 28Fedele et al.2017. The gender of the main BTSCs lines used in this study are BTSC 232 (male), BTSC 233 (female), BTSC 349 (female), and BTSC 380 (male). BTSCs were grown as neurospheres in Neurobasal medium (Gibco #10888022) containing B27 supplement (Gibco #12587010), N2 supplement (Gibco #17502048), b-FGF (20 ng/mL), EGF (20 ng/mL), LIF (10 ng/mL, CellGS #GFH200-20), and 2 µg/mL heparin and L-glutamine (2 mM). Patient-derived GBM stem cell lines h543 and h676, kindly provided by Eric C. Holland, were grown as neurospheres Human NeuroCult basal medium, supplemented with Proliferation supplement (Stem Cell Technologies #05751) and growth factors, as the mouse NSCs or tumorspheres (see above). BTSC 380 were differentiated by culturing them for 5 days with 0.5% FBS and 5 ng/mL of TNFalpha (Tebu-bio #300-01A-A) 71Schmitt et al.2021. All cell lines used were routinely tested for mycoplasma contamination by PCR.
The MAPK inhibitors GDC-0623, trametinib, and U0126 were purchased from Merck (Cat# AMBH303C5C40), Selleckchem (Cat# S2673), and Sigma-Aldrich (Cat# 662005), respectively.
Vectors, virus production, and infection
Flag-tagged NF1-GRD (aminoacids 1131–1534) was amplified by PCR from human cortical tissue (epilepsy patient) and first cloned in the pDRIVE vector (QIAGEN #231124). Primers are listed in Supplementary file 6. The NF1-GRD sequence was then excised by restriction digestion using PmeI and SpeI enzymes and subcloned in the modified pCHMWS lentiviral vector (kind gift from V. Baekelandt, University of Leuven, Belgium) sites by removing the fLUC region. The correct sequence was verified by sequencing. For NF1 silencing, shNF1 from pLKO (Sigma, TRCN0000238778) (shNF1_1) was subcloned in pGIPZ lentiviral vector (Open Biosystems). The corresponding short hairpin sequence was synthetized (GATC) and amplified by PCR using XhoI and EcoRI sites containing primers. The PCR product was digested using XhoI and EcoRI and subcloned into the pGIPZ vector previously digested with XhoI and PmeI followed by digestion with EcoRI. The two vector fragments were ligated with NF1 short hairpin fragment. The correct insertion and sequence was validated by sequencing. In addition, experiments were performed using shNF1-pGIPZ clone V2LHS76027 (sh_NF1_4) and V2LHS260806 (sh_NF1_5).
RCAS viruses (RCAS-shNf1, RCAS-sgNf1, and RCAS-KrasG12V) used for infection of p53-null NSCs were obtained from previously transfected DF1 chicken fibroblasts (ATCC #CRL-12203) using FuGENE 6 Transfection reagent (Promega #E2691), according to the manufacturer’s protocol. DF1 cells were grown at 39°C in DMEM containing GlutaMAX (Gibco #31966-021) and 10% FBS (Sigma-Aldrich #F7524).
The pKLV-U6gRNA-PGKpuro2ABFP was a gift from Dr. Kosuke Yusa (Wellcome Sanger Institute) (Addgene plasmid #50946). For cloning of single gRNAs, oligonucleotides containing the BbsI site and the specific gRNA sequences were annealed, phosphorylated, and ligated into the pKLV-U6gRNA(BbsI)-PGKpuro2ABFP previously digested with BbsI. Single gRNAs to target Fosl1 were designed with Guide Scan (http://www.guidescan.com/) and the sequences cloned were sgFosl1_1: TACCGAGACTACGGGGAACC; sgFosl1_2: CCTAGGGCTCGTATGACTCC; sgFosl1_3: ACCGTACGGGCTGCCAGCCC. These vectors and a non-targeting sgRNA control were used to transduce p53-null KrasG12V NSCs.
The pLVX-Cre and respective control vector were kindly provided by Dr. Maria Blasco (CNIO) and used to transduce Fosl1TetON NSCs; pSIN-EF1-puro-FLAG-FOSL1 pLKO.1-TET-shFOSL1_3 and shFOSL1_10 and respective control vectors were a gift from Dr. Silve Vicent (CIMA, Navarra University); pBabe-FOSL1 was previously described 57Matsuo et al.2000.
Gp2-293 packaging cell line (Clontech #631458) was grown in DMEM (Sigma-Aldrich #D5796) with 10% FBS. Lentiviruses generated in this cell line were produced using calcium-phosphate precipitate transfection and co-transfected with second-generation packaging vectors (pMD2G and psPAX2). High-titer virus was collected at 36 and 60 hr following transfection.
All cells were infected with lenti- or retroviruses by four cycles of spin infection (200 × g for 2 hr) in the presence of 8 μg/mL polybrene (Sigma-Aldrich #H9268). Transduced cells were selected after 48 hr from the last infection with 1 μg/mL puromycin (Sigma-Aldrich #P8833).
Generation of murine gliomas p53-null KrasG12V
Fosl1TetON NSCs (5 × 10⁵ cells) were intracranially injected into 4- to 5-week-old wildtype C57Bl/6J female mice that were fed ad libitum with 2 g/kg doxycycline-containing pellets. Due to the limited penetration of the blood–brain barrier and to ensure enough Dox was reaching the brain, 2 mg/mL Dox (PanReac AppliChem #A29510025) was also added to drinking water with 1% sucrose (Sigma-Aldrich #S0389) 3Annibali et al.201455Mansuy and Bujard2000. Control mice were kept with regular food and 1% sucrose drinking water.
Mice were anesthetized with 4% isofluorane and then injected with a stereotactic apparatus (Stoelting) as previously described 40Hambardzumyan et al.2009. After intracranial injection, all mice were routinely checked and sacrificed when developed symptoms of disease (lethargy, poor grooming, weight loss, and macrocephaly).
Immunohistochemistry
Tissue samples were fixed in 10% formalin, paraffin-embedded, and cut in 3 μm sections, which were mounted in Superfrost Plus microscope slides (Thermo Scientific #J1810AMNZ) and dried. Tissues were deparaffinized in xylene and re-hydrated through graded concentrations of ethanol in water, ending in a final rinse in water.
For histopathological analysis, sections were stained with hematoxylin and eosin (H&E).
For immunohistochemistry, deparaffinized sections underwent heat-induced antigen retrieval, endogenous peroxidase activity was blocked with 3% hydrogen peroxide (Sigma-Aldrich #H1009) for 15 min, and slides were then incubated in blocking solution (2.5% BSA [Sigma-Aldrich #A7906] and 10% Goat serum [Sigma-Aldrich #G9023], diluted in PBS) for at least 1 hr. Incubations with anti-FRA-1 (Santa Cruz #sc-183, 1:100) and anti-CD44 (BD Biosciences #550538, 1:100) were carried out overnight at 4°C. Slides were then incubated with secondary anti-rabbit (Vector #BA-1000) or anti-rat (Vector #BA-9400) for 1 hr at RT and with AB (avidin and biotinylated peroxidase) solution (Vectastain Elite ABC HRP Kit, Vector, PK-6100) for 30 min. Slides were developed by incubation with peroxidase substrate DAB (Vector SK-4100) until desired stain intensity. Finally, slides were counterstained with hematoxylin, cleared, and mounted with a permanent mounting medium.
Immunohistochemistry for S100A4 (Abcam #ab27957, 1:300) and Ki67 (Master Diagnostica #0003110QD, undiluted) was performed using an automated immunostaining platform (Ventana discovery XT, Roche).
Immunoblotting
Cell pellets or frozen tumor tissues were lysed with JS lysis buffer (50 mM HEPES, 150 mM NaCl, 1% glycerol, 1% Triton X-100, 1.5 mM MgCl2, 5 mM EGTA), and protein concentrations were determined by DC protein assay kit II (Bio-Rad #5000112). Proteins were separated on house-made SDS-PAGE gels and transferred to nitrocellulose membranes (Amersham #10600003). Membranes were incubated in blocking buffer (5% milk in TBST) and then with primary antibody overnight at 4°C. The following primary antibodies and respective dilutions were used: FLAG (Cell Signaling Technology #2368S, 1:2000), FRA-1 (Santa Cruz #sc-183, 1:1000; #sc-605, 1:1000), GFAP (Sigma-Aldrich #G3893, 1:5000), NF1 (Santa Cruz #sc-67, 1:500; Bethyl #A300-140A, 1:1000), OLIG2 (Millipore #AB9610, 1:2000), VIMENTIN (Cell Signaling Technology #5741, 1:3000), p-ERK1/2 (T202/Y204) (Cell Signaling Technology, #9101, 1:2000/3000; Assay Designs #ADI-905-651, 1:250), ERK1/2 (Cell Signaling Technology, #9102, 1:1000; Abcam #ab17942, 1:1000), p-MEK (S217/221) (Cell Signaling Technology, #9154, 1:500/1000), MEK (Cell Signaling Technology, #9122 1:1000), CHI3L1 (Qidel #4815, 1:1000), p85 (Millipore #06-195, 1:10,000), vinculin (Sigma-Aldrich #V9131, 1:10,000), and α-tubulin (Abcam #ab7291, 1:10,000). Anti-mouse or rabbit-HRP-conjugated antibodies (Jackson ImmunoResearch, #115-035-003 and #111-035-003) were used to detect desired protein by chemiluminescence with ECL Detection Reagent (Amersham, #RPN2106).
Reverse transcription quantitative PCR
RNA from NSCs and frozen tissue was isolated with TRIzol reagent (Invitrogen #15596-026) according to the manufacturer’s instructions. For reverse transcription PCR (RT-PCR), 500 ng of total RNA was reverse transcribed using the High Capacity cDNA Reverse Transcription Kit (Applied Biosystems #4368814). Quantitative PCR was performed using the SYBR Select Master Mix (Applied Biosystems #4472908) according to the manufacturer’s instructions. qPCRs were run and the melting curves of the amplified products were used to determine the specificity of the amplification. The threshold cycle number for the genes analyzed was normalized to GAPDH. Mouse and human primer sequences are listed in Supplementary file 6.
RNA from BTSC cells was prepared using the RNeasy kit or the AllPrep DNA/RNA Protein Mini Kit and used for first-strand cDNA synthesis using random primers and SuperscriptIII reverse transcriptase (Life Technologies #18080-085). Primer sequences used in qRT-PCR with SYBR Green are listed in Supplementary file 6. Quantitative real-time PCR (qRT-PCR) STAT3 and CEBPB were performed using pre-validated TaqMan assays (Applied Biosystems): STAT3: Hs01047580, CEBPB: Hs00270923 and 18S rRNA: Hs99999901.
MTT assay
Cells were seeded in 96-well culture plates (1000 cells per well, 10 wells per cell line) and grown for 7 days. At each timepoint (days 1, 3, 5, and 7), cell viability was determined by MTT assay. Briefly, 10 µL of 5 mg/mL MTT (Sigma-Aldrich #M5655) was added to each well and cells were incubated for 4 hr before lysing with a formazan solubilization solution (10% SDS in 0.01 M HCl). Colorimetric intensity was quantified using a plate reader at 590 nm. Values were obtained after subtraction of matched blanks (medium only).
Cell cycle analysis: propidium iodide (PI) staining
Cells were harvested and washed twice with PBS prior to fixation with 70% cold ethanol, added drop-wise to the cell pellet while vortexing. Fixed cells were then washed, first with 1% BSA in PBS, then with PBS only and stained overnight with 50 µg/mL PI (Sigma-Aldrich #P4170) and 100 µg/mL RNase A (Roche #10109142001) in PBS. Samples were acquired in a FACSCanto II cytometer (BD Biosciences), and data were analyzed using FlowJo software.
BrdU and EdU incorporation assays
Cells were pulse-labeled with 10 µM BrdU (Sigma-Aldrich #B9285) for 2 hr, harvested and washed twice with PBS prior to fixation with 70% cold ethanol, and added drop-wise to the cell pellet while vortexing. DNA denaturation was performed by incubating samples for 10 min on ice with 0.1 M HCl with 0.5% Tween-20, and samples were then resuspended in water and boiled at 100°C for 10 min. Anti-BrdU‐FITC antibody (BD Biosciences #556028) was incubated according to the manufacturer's protocol. After washing with PBSTB (PBS with 0.5% Tween-20% and 1% BSA), samples were resuspended in 25 µg/mL PI and 100 µg/mL RNase A diluted in PBS. Samples were acquired in a FACSCanto II cytometer (BD Biosciences), and data were analyzed using FlowJo software.
EdU incorporation was assessed using the EdU-Click594 Cell Proliferation Imaging Kit (Baseclick GmbH) according to the manufacturer's instructions. 96 hr after transduction, 2.0 × 10⁴ BTSC 233 cells were seeded on laminin-coated glass coverslips in a 24-well cell culture plate. Pictures were acquired using an Axiovert Microscope (Zeiss).
Immunofluorescence
Cells were plated in laminin-coated coverslips and fixed with 4% PFA for 15 min. Cells were then permeabilized with 0.1% Triton X-100 in 0.2% BSA, and coverslips were washed and blocked with 10% donkey serum in 0.2% BSA for 1 hr. The following primary antibodies were incubated overnight at 4°C: CD44 (BD Biosciences #550538, 1:100), GFAP (Millipore #MAB360, 1:400), and OLIG2 (Millipore #AB9610, 1:100). Secondary antibodies at 1:400 dilution (from Invitrogen, Alexa-Fluor anti-rabbit-488, anti-mouse-488, and anti-rat 594) were incubated for 1 hr at RT and after washing coverslips were incubated for 4 min with DAPI (1:4000, Sigma-Aldrich #D8417) and mounted with ProLong Gold Antifade reagent (Invitrogen #P10144).
Fluorescence signal was quantified as the ratio of green/red pixel area relative to DAPI pixel area per field of view in a total of 36 fields per condition analyzed.
Neurosphere formation assay and limiting dilution analysis
Neurospheres were dissociated and passed through a 40 μm mesh filter to eliminate non-single cells. Decreasing cell densities were plated in ultra-low attachment 96-well plates (Corning #CLS3474), and fresh medium was added every 3–4 days. The number of positive wells for the presence of spheres was counted 2 weeks after plating. Limiting dilution analysis was performed using ELDA R package (http://bioinf.wehi.edu.au/software/elda/).
RNA-sequencing and analysis on mouse NSCs
For the p53-null KrasG12V NSCs, 1 μg of total RNA from the samples was used. cDNA libraries were prepared using the ‘QuantSeq 3 ‘mRNA-Seq Library Prep Kit (FWD) for Illumina’ (Lexogen #015) by following the manufacturer's instructions. Library generation is initiated by reverse transcription with oligo(dT) priming, and a second-strand synthesis is performed from random primers by a DNA polymerase. Primers from both steps contain Illumina-compatible sequences. Adapter-ligated libraries were completed by PCR, applied to an Illumina flow cell for cluster generation, and sequenced on an Illumina HiSeq 2500 by following the manufacturer's protocols. Sequencing read alignment and quantification and differential gene expression analysis was performed in the Bluebee Genomics Platform, a cloud-based service provider (https://www.illumina.com/company/about-us/mergers-acquisitions/bluebee.html). Briefly, reads were first trimmed with bbduk from BBTools (BBMap – Bushnell B, https://sourceforge.net/projects/bbmap/) to remove adapter sequences and polyA tails. Trimmed reads were aligned to the GRCm38/mm10 genome assembly with STAR v 2.5 25Dobin et al.2013. Read counting was performed with HTSeq 1Anders et al.2015. The list of stem/differentiation markers was compiled by combining a previously described gene list 69Sandberg et al.2013 with other markers 7Bazzoli et al.2012.
For the p53-null shNf1 NSCs, total RNA samples (500 ng) were converted into sequencing libraries with the ‘NEBNext Ultra II Directional RNA Library Prep Kit for Illumina’ (NEB #E7760), as recommended by the manufacturer. Briefly, polyA+ fraction is purified and randomly fragmented, converted to double-stranded cDNA, and processed through subsequent enzymatic treatments of end-repair, dA-tailing, and ligation to adapters. Adapter-ligated library is completed by PCR with Illumina PE primers. The resulting purified cDNA libraries were applied to an Illumina flow cell for cluster generation and sequenced on an Illumina NextSeq 550 by following the manufacturer's protocols. We then used the Nextpresso pipeline 37Graña et al.2018 for alignment and quantification.
Osteogenesis differentiation assay
The osteogenesis differentiation assay was performed using the StemPro Osteogenesis Differentiation Kit (Life Technologies #A1007201) according to the manufacturer’s instructions. Briefly, 5 × 10³ cells/cm2 were seeded on laminin-coated glass coverslips in a 24-well cell culture plate. Cells were incubated in MSC Growth Medium at 37°C, 5% CO2 for 21 days, replacing the medium every 4 days. Cells were then fixed with 4% formaldehyde, stained with Alizarin Red S solution (pH 4.2), and mounted on microscope slides. Pictures were acquired using an Axiovert Microscope (Zeiss).
Active Ras pull-down assay
Active Ras pull-down assay was performed using Active Ras pull-down assay kit (Thermo Fisher Scientific #16117) according to the manufacturer’s instructions. Briefly, cells were grown in 10 cm plates at 80–90% confluency in the presence or absence of growth factors (EGF, FGF, and LIF) and lysed with the provided buffer. Lysates were incubated with either GDP or GTP for 30 min followed by precipitation with GST-Raf1-RBD. Western blot was performed with the provided anti-RAS antibody (1:250).
Chromatin preparation and FRA-1 ChIP
BTSC cells were collected at 2 × 10⁶ cells confluency, washed in PBS, and fixed by addition of 1% formaldehyde for 20 min at room temperature. The cells were resuspended in 2 mL lysis buffer (50 mM Tris pH 7.5; 1 mM EDTA pH 8.0; 1% Triton; 0.1% Na-deoxycholate; 150 mM NaCl; protease inhibitors) on ice for 20 min. The suspension was sonicated in a cooled Bioruptor Pico (Diagenode) and cleared by centrifugation for 10 min at 13,000 rpm. The chromatin (DNA) concentration was quantified using NanoDrop (Thermo Scientific), and the sonication efficiency was monitored on an agarose gel. Protein A/G plus-agarose beads (Santa Cruz #sc-2003) were blocked with sonicated salmon sperm (Thermo Fisher #AM9680, 200 mg/mL beads) and BSA (NEB #B9000S, 250 mg/mL beads) in dilution buffer (0.5% NP40; 200 mM NaCl; 50 mM Tris pH 8.0; protease inhibitors) for 2 hr at room temperature. The chromatin was pre-cleared with 80 µL of blocked beads for 1 hr at 4°C. Pre-cleared chromatin was incubated with 5 µg of FRA-1 antibody (Santa Cruz #sc-605) overnight at 4°C, then with 40 µL of blocked beads for further 2 hr at 4°C. Control mock immunoprecipitation was performed with blocked beads. The beads were washed 1× with Wash1 (20 mM Tris pH 7.5; 2 mM EDTA pH 8.0; 1% Triton; 0.1% SDS; 150 mM NaCl), 1× with Wash2 (20 mM Tris pH 7.5; 2 mM EDTA pH 8.0; 1% Triton; 0.1% SDS; 500 mM NaCl), 1× with LiCl Wash (20 mM Tris pH 7.5; 1 mM EDTA pH 8.0; 1% NP40; 1% deoxycholate; 250 mM LiCl), and 2× in TE (10 mM Tris pH 7.5; 1 mM EDTA). The immuno-complexes were eluted by two 15 min incubations at 30°C with 100 μL Elution buffer (1% SDS, 100 mM NaHCO3), and de-crosslinked overnight at 65°C in the presence of 10 U RNase A (Ambion #AM9780). The immune-precipitated DNA was then purified with the QIAquick PCR purification kit (QIAGEN #28104) according to the manufacturer's protocol and analyzed by quantitative real-time PCR.
Statistical analysis
All statistical analyses were performed using R programming language (3.6.3). Statistical differences between groups were assessed by one-way ANOVA, two-way ANOVA, or unpaired two-tailed Student’s t tests unless otherwise specified.
Kaplan–Meier survival curves were produced with GraphPad Prism, and p-values were generated using the log-rank statistics.
Results are presented as mean ± standard deviation (SD), and statistical significance was defined as p≤0.05 for a 95% confidence interval.
Code availability
The accession numbers for data reported in this paper are GEO: GSE137310 (Freiburg BTSCs) and GSE138010 (mouse p53-null KrasG12V NSCs). All the R code and data used for analysis and plots generation are available at: https://github.com/squatrim/Marques2020 (copy archived at swh:1:rev:45e31e7d17f006d2d3a17e66a63449f758bf5998074Squatrito2021).
References
-
- SAnders
- PTPyl
- WHuber
-
- CAndreolas
- MKalogeropoulou
- AVoulgari
- APintzas
-
- DAnnibali
- JRWhitfield
- EFavuzzi
- TJauset
- ESerrano
- ICuartas
- SRedondo-Campos
- GFolch
- AGonzàlez-Juncà
- NMSodir
- DMassó-Vallés
- M-EBeaulieu
- LBSwigart
- MMMc Gee
- MPSomma
- SNasi
- JSeoane
- GIEvan
- LSoucek
-
- LBakiri
- SMacho-Maschler
- ICustic
- JNiemiec
- AGuío-Carrión
- SCHasenfuss
- AEger
- MMüller
- HBeug
- EFWagner
-
- SBao
- QWu
- REMcLendon
- YHao
- QShi
- ABHjelmeland
- MWDewhirst
- DDBigner
- JNRich
-
- KBasso
- AAMargolin
- GStolovitzky
- UKlein
- RDalla-Favera
- ACalifano
-
- EBazzoli
- TPulvirenti
- MCOberstadt
- FPerna
- BWee
- NSchultz
- JTHuse
- EIFomchenko
- FVoza
- VTabar
- CWBrennan
- LMDeAngelis
- SDNimer
- ECHolland
- MSquatrito
-
- GBelteki
-
- KPBhat
- KLSalazar
- VBalasubramaniyan
- KWani
- LHeathcock
- FHollingsworth
- JDJames
- JGumin
- KLDiefes
- SHKim
- ATurski
- YAzodi
- YYang
- TDoucette
- HColman
- EPSulman
- FFLang
- GRao
- SCopray
- BDVaillant
- KDAldape
-
- KPLBhat
- VBalasubramaniyan
- BVaillant
- REzhilarasan
- KHummelink
- FHollingsworth
- KWani
- LHeathcock
- JDJames
- LDGoodman
- SConroy
- LLong
- NLelic
- SWang
- JGumin
- DRaj
- YKodama
- ARaghunathan
- AOlar
- KJoshi
- CEPelloski
- AHeimberger
- SHKim
- DPCahill
- GRao
- WFADen Dunnen
- HBoddeke
- HSPhillips
- INakano
- FFLang
- HColman
- EPSulman
- KAldape
-
- RLBowman
- QWang
- ACarro
- RGVerhaak
- MSquatrito
-
- CWBrennan
- RGVerhaak
- AMcKenna
- BCampos
- HNoushmehr
- SRSalama
- SZheng
- DChakravarty
- JZSanborn
- SHBerman
- RBeroukhim
- BBernard
- CJWu
- GGenovese
- IShmulevich
- JBarnholtz-Sloan
- LZou
- RVegesna
- SAShukla
- GCiriello
- WKYung
- WZhang
- CSougnez
- TMikkelsen
- KAldape
- DDBigner
- EGVan Meir
- MPrados
- ASloan
- KLBlack
- JEschbacher
- GFinocchiaro
- WFriedman
- DWAndrews
- AGuha
- MIacocca
- BPO'Neill
- GFoltz
- JMyers
- DJWeisenberger
- RPenny
- RKucherlapati
- CMPerou
- DNHayes
- RGibbs
- MMarra
- GBMills
- ELander
- PSpellman
- RWilson
- CSander
- JWeinstein
- MMeyerson
- SGabriel
- PWLaird
- DHaussler
- GGetz
- LChin
- TCGA Research Network
-
- JDBuenrostro
- PGGiresi
- LCZaba
- HYChang
- WJGreenleaf
-
- Cancer Genome Atlas Research Network
-
- MSCarro
- WKLim
- MJAlvarez
- RJBollo
- XZhao
- EYSnyder
- EPSulman
- SLAnne
- FDoetsch
- HColman
- ALasorella
- KAldape
- ACalifano
- AIavarone
-
- LCasalino
- DDe Cesare
- PVerde
-
- MACastro
- ISantiago
- TMCampbell
- CVaughn
- TEHickey
- ERoss
- WDTilley
- FMarkowetz
- BAPonder
- KBMeyer
-
- MCeccarelli
- FPBarthel
- TMMalta
- TSSabedot
- SRSalama
- BAMurray
- OMorozova
- YNewton
- ARadenbaugh
- SMPagnotta
- SAnjum
- JWang
- GManyam
- PZoppoli
- SLing
- AARao
- MGrifford
- ADCherniack
- HZhang
- LPoisson
- CGCarlotti
- DPTirapelli
- ARao
- TMikkelsen
- CCLau
- WKYung
- RRabadan
- JHuse
- DJBrat
- NLLehman
- JSBarnholtz-Sloan
- SZheng
- KHess
- GRao
- MMeyerson
- RBeroukhim
- LCooper
- RAkbani
- MWrensch
- DHaussler
- KDAldape
- PWLaird
- DHGutmann
- HNoushmehr
- AIavarone
- RGVerhaak
- TCGA Research Network
-
- JChen
- YLi
- TSYu
- RMMcKay
- DKBurns
- SGKernie
- LFParada
-
- GChiappetta
- AFerraro
- GBotti
- MMonaco
- RPasquinelli
- EVuttariello
- LArnaldi
- MDi Bonito
- GD'Aiuto
- GMPierantoni
- AFusco
-
- LACooper
- DAGutman
- CChisolm
- CAppin
- JKong
- YRong
- TKurc
- EGVan Meir
- JHSaltz
- CSMoreno
- DJBrat
-
- CCusulin
- CChesnelong
- PBose
- MBilenky
- KKopciuk
- JAChan
- JGCairncross
- SJJones
- MAMarra
- HALuchman
- SWeiss
-
- WDebinski
- DMGibo
-
- JDiesch
- ESanij
- OGilan
- CLove
- HTran
- NIFleming
- JEllul
- MAmalia
- IHaviv
- RBPearson
- ETulchinsky
- JMMariadason
- OMSieber
- RDHannan
- ASDhillon
-
- ADobin
- CADavis
- FSchlesinger
- JDrenkow
- CZaleski
- SJha
- PBatut
- MChaisson
- TRGingeras
-
- REferl
- EFWagner
-
- CEsnault
- FGualdrini
- SHorswell
- GKelly
- AStewart
- PEast
- NMatthews
- RTreisman
-
- VFedele
- FDai
- APMasilamani
- DHHeiland
- EKling
- AMGätjens-Sanchez
- RFerrarese
- LPlatania
- DSoroush
- HKim
- SNelander
- AWeyerbrock
- MPrinz
- ACalifano
- AIavarone
- MBredel
- MSCarro
-
- MFedele
- LCerchia
- SPegoraro
- RSgarra
- GManfioletti
-
- GFiscon
- FConte
- PPaci
-
- MNFletcher
- MACastro
- XWang
- ISantiago
- MO'Reilly
- SFChin
- OMRueda
- CCaldas
- BAPonder
- FMarkowetz
- KBMeyer
-
- DFriedmann-Morvinski
- EABushong
- EKe
- YSoda
- TMarumoto
- OSinger
- MHEllisman
- IMVerma
-
- X-QGao
- Y-SGe
- Q-HShu
- H-XMa
-
- GGargiulo
- MCesaroni
- MSerresi
- NVries
- DHulsman
- SWBruggeman
- CLancini
- MLohuizen
-
- LGautier
- LCope
- BMBolstad
- RAIrizarry
-
- BGel
- ESerra
-
- OGraña
- MRubio-Camarillo
- FFdez-Riverola
- DGPisano
- DGlez-Peña
-
- HSGünther
- NOSchmidt
- HSPhillips
- DKemming
- SKharbanda
- RSoriano
- ZModrusan
- HMeissner
- MWestphal
- KLamszus
-
- JHalliday
- KHelmy
- SSPattwell
- KLPitter
- QLaPlant
- TOzawa
- ECHolland
-
- DHambardzumyan
- NMAmankulor
- KYHelmy
- OJBecher
- ECHolland
-
- THara
- RChanoch-Myers
- NDMathewson
- CMyskiw
- LAtta
- LBussema
- SWEichhorn
- ACGreenwald
- GSKinker
- CRodman
- LNGonzalez Castro
- HWakimoto
- ORozenblatt-Rosen
- XZhuang
- JFan
- THunter
- IMVerma
- KWWucherpfennig
- ARegev
- MLSuvà
- ITirosh
-
- SCHasenfuss
- LBakiri
- MKThomsen
- RHamacher
- EFWagner
-
- BPHennig
- LVelten
- IRacke
- CSTu
- MThoms
- VRybin
- HBesir
- KRemans
- LMSteinmetz
-
- ECHolland
- JCelestino
- CDai
- LSchaefer
- RESawaya
- GNFuller
-
- CKoschmann
- AACalinescu
- FJNunez
- AMackay
- JFazal-Salom
- DThomas
- FMendez
- NKamran
- MDzaman
- LMulpuri
- JKrasinkiewicz
- RDoherty
- RLemons
- JABrosnan-Cashman
- YLi
- SRoh
- LZhao
- HAppelman
- DFerguson
- VGorbunova
- AMeeker
- CJones
- PRLowenstein
- MGCastro
-
- SALambert
- AJolma
- LFCampitelli
- PKDas
- YYin
- MAlbu
- XChen
- JTaipale
- TRHughes
- MTWeirauch
-
- BLangmead
- SLSalzberg
-
- EYLau
- JLo
- BYCheng
- MKMa
- JMLee
- JKNg
- SChai
- CHLin
- SYTsang
- SMa
- IONg
- TKLee
-
- TLi
- JFu
- ZZeng
- DCohen
- JLi
- QChen
- BLi
- XSLiu
-
- HLiu
- GRen
- TWang
- YChen
- CGong
- YBai
- BWang
- HQi
- JShen
- LZhu
- CQian
- MLai
- JShao
-
- DNLouis
- APerry
- GReifenberger
- ADeimling
- DFigarella-Branger
- WKCavenee
- HOhgaki
- ODWiestler
- PKleihues
- DWEllison
-
- MILove
- WHuber
- SAnders
-
- SCMack
- ISingh
- XWang
- RHirsch
- QWu
- RVillagomez
- JABernatchez
- ZZhu
- RCGimple
- LJYKim
- AMorton
- SLai
- ZQiu
- BCPrager
- KCBertrand
- CMah
- WZhou
- CLee
- GHBarnett
- MAVogelbaum
- AESloan
- LChavez
- SBao
- PCScacheri
- JLSiqueira-Neto
- CYLin
- JNRich
-
- SAMani
- WGuo
- MJLiao
- ENEaton
- AAyyanan
- AYZhou
- MBrooks
- FReinhard
- CCZhang
- MShipitsin
- LLCampbell
- KPolyak
- CBrisken
- JYang
- RAWeinberg
-
- IMMansuy
- HBujard
-
- PMao
- KJoshi
- JLi
- SHKim
- PLi
- LSantana-Santos
- SLuthra
- URChandran
- PVBenos
- LSmith
- MWang
- BHu
- SYCheng
- RWSobol
- INakano
-
- KMatsuo
- JMOwens
- MTonko
- CElliott
- TJChambers
- EFWagner
-
- FMcCormick
-
- DMMuñoz
- TTung
- SAgnihotri
- SSingh
- AGuha
- GZadeh
- CHawkins
-
- CNeftel
- JLaffy
- MGFilbin
- THara
- MEShore
- GJRahme
- ARRichman
- DSilverbush
- MLShaw
- CMHebert
- JDewitt
- SGritsch
- EMPerez
- LNGonzalez Castro
- XLan
- NDruck
- CRodman
- DDionne
- AKaplan
- MSBertalan
- JSmall
- KPelton
- SBecker
- DBonal
- Q-DNguyen
- RLServis
- JMFung
- RMylvaganam
- LMayr
- JGojo
- CHaberler
- RGeyeregger
- TCzech
- ISlavc
- BVNahed
- WTCurry
- BSCarter
- HWakimoto
- PKBrastianos
- TTBatchelor
- AStemmer-Rachamimov
- MMartinez-Lage
- MPFrosch
- IStamenkovic
- NRiggi
- ERheinbay
- MMonje
- ORozenblatt-Rosen
- DPCahill
- APPatel
- THunter
- IMVerma
- KLLigon
- DNLouis
- ARegev
- BEBernstein
- ITirosh
- MLSuvà
-
- BOldrini
- ÁCuriel-García
- CMarques
- VMatia
- ÖUluçkan
- OGraña-Castro
- RTorres-Ruiz
- SRodriguez-Perales
- JTHuse
- MSquatrito
-
- TOzawa
- MRiester
- YKCheng
- JTHuse
- MSquatrito
- KHelmy
- NCharles
- FMichor
- ECHolland
-
- APPatel
- ITirosh
- JJTrombetta
- AKShalek
- SMGillespie
- HWakimoto
- DPCahill
- BVNahed
- WTCurry
- RLMartuza
- DNLouis
- ORozenblatt-Rosen
- MLSuvà
- ARegev
- BEBernstein
-
- HSPhillips
- SKharbanda
- RChen
- WFForrest
- RHSoriano
- TDWu
- AMisra
- JMNigro
- HColman
- LSoroceanu
- PMWilliams
- ZModrusan
- BGFeuerstein
- KAldape
-
- FRamírez
- DPRyan
- BGrüning
- VBhardwaj
- FKilpert
- ASRichter
- SHeyne
- FDündar
- TManke
-
- LRicci-Vitiani
- RPallini
- LMLarocca
- DGLombardi
- MSignore
- FPierconti
- GPetrucci
- NMontano
- GMaira
- RDe Maria
-
- LMRichards
- OKNWhitley
- GMacLeod
- FMGCavalli
- FJCoutinho
- JEJaramillo
- NSvergun
- MRiverin
- DCCroucher
- MKushida
- KYu
- PGuilhamon
- NRastegar
- MAhmadi
- JKBhatti
- DABozek
- NLi
- LLee
- CChe
- ELuis
- NIPark
- ZXu
- TKetela
- RAMoore
- MAMarra
- JSpears
- MDCusimano
- SDas
- MBernstein
- BHaibe-Kains
- MLupien
- HALuchman
- SWeiss
- SAngers
- PBDirks
- GDBader
- TJPugh
-
- MERitchie
- BPhipson
- DWu
- YHu
- CWLaw
- WShi
- GKSmyth
-
- CJSandberg
- GAltschuler
- JJeong
- KKStrømme
- BStangeland
- WMurrell
- UHGrasmo-Wendler
- OMyklebost
- EHelseth
- EOVik-Mo
- WHide
- IALangmoen
-
- ANSchep
- BWu
- JDBuenrostro
- WJGreenleaf
-
- MJSchmitt
- CCompany
- YDramaretska
- IBarozzi
- AGöhrig
- SKertalli
- MGroßmann
- HNaumann
- MPSanchez-Bailon
- DHulsman
- RGlass
- MSquatrito
- MSerresi
- GGargiulo
-
- MSerresi
- SKertalli
- LLi
- MJSchmitt
- YDramaretska
- JWierikx
- DHulsman
- GGargiulo
-
- ASottoriva
- ISpiteri
- SGPiccirillo
- ATouloumis
- VPCollins
- JCMarioni
- CCurtis
- CWatts
- STavaré
-
- MSquatrito
-
- ASubramanian
- PTamayo
- VKMootha
- SMukherjee
- BLEbert
- MAGillette
- APaulovich
- SLPomeroy
- TRGolub
- ESLander
- JPMesirov
-
- MLSuvà
- ERheinbay
- SMGillespie
- APPatel
- HWakimoto
- SDRabkin
- NRiggi
- ASChi
- DPCahill
- BVNahed
- WTCurry
- RLMartuza
- MNRivera
- NRossetti
- SKasif
- SBeik
- SKadri
- ITirosh
- IWortman
- AKShalek
- ORozenblatt-Rosen
- ARegev
- DNLouis
- BEBernstein
-
- WLTam
- HLu
- JBuikhuisen
- BSSoh
- ELim
- FReinhardt
- ZJWu
- JAKrall
- BBierie
- WGuo
- XChen
- XSLiu
- MBrown
- BLim
- RAWeinberg
-
- WLTam
- RAWeinberg
-
- CLTso
- PShintaku
- JChen
- QLiu
- JLiu
- ZChen
- KYoshimoto
- PSMischel
- TFCloughesy
- LMLiau
- SFNelson
-
- LUhrbom
- CDai
- JCCelestino
- MKRosenblum
- GNFuller
- ECHolland
-
- AUsui
- IHoshino
- YAkutsu
- HSakata
- TNishimori
- KMurakami
- MKano
- KShuto
- HMatsubara
-
- AVallejo
- NPerurena
- EGuruceaga
- PKMazur
- SMartinez-Canarias
- CZandueta
- KValencia
- AArricibita
- DGwinn
- LCSayles
- CHChuang
- LGuembe
- PBailey
- DKChang
- ABiankin
- MPonz-Sarvise
- JBAndersen
- PKhatri
- ABozec
- EASweet-Cordero
- JSage
- FLecanda
- SVicent
-
- FSVarn
- KCJohnson
- TEWade
- TMMalta
- TSSabedot
- FPBarthel
- HKim
- NAhmed
- IDatta
- JSBarnholtz-Sloan
- SBakas
- FD’Angelo
- HKGan
- LGarofano
- JTHuse
- MKhasraw
- EKocakavuk
- SMigliozzi
- DROrmond
- SHPaek
- MEGVan
- AMEWalenkamp
- CWatts
- MWeller
- TWeiss
- PWesseling
- LFStead
- LMPoisson
- HNoushmehr
- AIavarone
- RGVerhaak
- TGConsortium
-
- PVerde
- LCasalino
- FTalotta
- MYaniv
- JBWeitzman
-
- RGVerhaak
- KAHoadley
- EPurdom
- VWang
- YQi
- MDWilkerson
- CRMiller
- LDing
- TGolub
- JPMesirov
- GAlexe
- MLawrence
- MO'Kelly
- PTamayo
- BAWeir
- SGabriel
- WWinckler
- SGupta
- LJakkula
- HSFeiler
- JGHodgson
- CDJames
- JNSarkaria
- CBrennan
- AKahn
- PTSpellman
- RKWilson
- TPSpeed
- JWGray
- MMeyerson
- GGetz
- CMPerou
- DNHayes
- Cancer Genome Atlas Research Network
-
- JWang
- ECazzato
- ELadewig
- VFrattini
- DISRosenbloom
- SZairis
- FAbate
- ZLiu
- OElliott
- Y-JShin
- J-KLee
- I-HLee
- W-YPark
- MEoli
- AJBlumberg
- ALasorella
- D-HNam
- GFinocchiaro
- AIavarone
- RRabadan
-
- QWang
- BHu
- XHu
- HKim
- MSquatrito
- LScarpace
- ACdeCarvalho
- SLyu
- PLi
- YLi
- FBarthel
- HJCho
- YHLin
- NSatani
- EMartinez-Ledesma
- SZheng
- EChang
- CGSauvé
- AOlar
- ZDLan
- GFinocchiaro
- JJPhillips
- MSBerger
- KRGabrusiewicz
- GWang
- EEskilsson
- JHu
- TMikkelsen
- RADePinho
- FMuller
- ABHeimberger
- EPSulman
- DHNam
- RGWVerhaak
-
- LWang
- HBabikir
- SMüller
- GYagnik
- KShamardani
- FCatalan
- GKohanbash
- BAlvarado
- EDi Lullo
- AKriegstein
- SShah
- HWadhwa
- SMChang
- JJPhillips
- MKAghi
- AADiaz
-
- JWu
- AJi
- XWang
- YZhu
- YYu
- YLin
- YLiu
- SLi
- ZLiang
- XXu
- XZheng
- LXie
-
- YWu
- MFletcher
- ZGu
- QWang
- BCosta
- ABertoni
- KHMan
- MSchlotter
- JFelsberg
- JMangei
- MBarbus
- ACGaupel
- WWang
- TWeiss
- REils
- MWeller
- HLiu
- GReifenberger
- AKorshunov
- PAngel
- PLichter
- CHerrmann
- BRadlwimmer
-
- HXu
- XJin
- YYuan
- PDeng
- LJiang
- XZeng
- XSLi
- ZYWang
- QMChen
-
- XYe
- WLTam
- TShibue
- YKaygusuz
- FReinhardt
- ENg Eaton
- RAWeinberg
-
- HYounesy
- CBNielsen
- MCLorincz
- SJJones
- MMKarimi
- TMöller
-
- GYu
- L-GWang
- YHan
- Q-YHe
-
- YZhang
- TLiu
- CAMeyer
- JEeckhoute
- DSJohnson
- BEBernstein
- CNusbaum
- RMMyers
- MBrown
- WLi
- XSLiu
-
- ZZhao
- FMeng
- WWang
- ZWang
- CZhang
- TJiang