Valence biases in reinforcement learning shift across adolescence and modulate subsequent memory
- GailMRosenbaum1
- HannahLGrassie1
- CatherineAHartley[email protected]12
- Research Article
- Neuroscience
- valence asymmetries
- reinforcement learning
- memory
- adolescence
- decision making
- individual diferences
- Human
- publisher-id64620
- doi10.7554/eLife.64620
- elocation-ide64620
Abstract
As individuals learn through trial and error, some are more influenced by good outcomes, while others weight bad outcomes more heavily. Such valence biases may also influence memory for past experiences. Here, we examined whether valence asymmetries in reinforcement learning change across adolescence, and whether individual learning asymmetries bias the content of subsequent memory. Participants ages 8–27 learned the values of ‘point machines,’ after which their memory for trial-unique images presented with choice outcomes was assessed. Relative to children and adults, adolescents overweighted worse-than-expected outcomes during learning. Individuals’ valence biases modulated incidental memory, such that those who prioritized worse- (or better-) than-expected outcomes during learning were also more likely to remember images paired with these outcomes, an effect reproduced in an independent dataset. Collectively, these results highlight age-related changes in the computation of subjective value and demonstrate that a valence-asymmetric valuation process influences how information is prioritized in episodic memory.
Introduction
Throughout our lives, we encounter many new or uncertain situations in which we must learn, through trial and error, which actions are beneficial and which are best avoided. Determining which behaviors will earn praise from a teacher, which social media posts will be liked by peers, or which route to work will have the least traffic is often accomplished by exploring different actions, and learning from the good or bad outcomes that they yield. Importantly, individuals differ in the extent to which their evaluations 27Daw et al.200235Frank et al.200441Gershman201552Lefebvre et al.201788Sharot and Garrett2016 and their memories 57Madan et al.201458Madan et al.201783Rouhani and Niv2019 are influenced by good versus bad experiences. For example, consider a diner who has a delicious meal on her first visit to a new sushi restaurant, but on her next visit, the meal is not very good. A tendency to place greater weight on past positive experiences might make her both more likely to remember the good dining experience and more likely to return and try the restaurant again. In contrast, if the recent negative experience exerts an outsized influence, it may be more easily called to mind and she may forego another visit to that restaurant in favor of a surer bet. In this manner, asymmetric prioritization of past positive versus negative outcomes may render these valenced experiences more persistent in our memories and systematically alter how we make future decisions about uncertain prospects.
Understanding how experiential learning informs decision-making under uncertainty may be particularly important during adolescence, when teens’ burgeoning independence offers more frequent exposure to novel contexts in which the potential positive or negative outcomes of an action may be uncertain. Epidemiological data reveal an adolescent peak in the prevalence of many ‘risky’ behaviors that carry potential negative consequences (e.g., criminal behavior 93Steinberg2013, risky sexual behavior 85Satterwhite et al.2013). Moreover, consistent with proposals that adolescent risk taking might be driven by heightened sensitivity to rewarding outcomes 15Casey et al.200839Galván201389Silverman et al.201592Steinberg200899Duijvenvoorde et al.2017, several neuroimaging studies have observed that adolescents exhibit neural responses to reward that are greater in magnitude than those of children or adults 12Braams et al.201523Cohen et al.201038Galvan et al.200689Silverman et al.2015100Van Leijenhorst et al.2010. These findings suggest that as adolescents learn to evaluate novel situations through trial and error, positive experiences might exert an outsized influence on their subsequent actions and choices.
Reinforcement learning (RL) models mathematically formalize the process of evaluating actions based on their resulting good and bad outcomes 94Sutton and Barto1998. In such models, action value estimates are iteratively revised based on prediction errors or the extent to which an experienced outcome deviates from one’s current expectation. The magnitude of the resulting value update is scaled by an individual’s learning rate. Valence asymmetries in the estimation of action values can be captured by positing two distinct learning rates for positive versus negative prediction errors, leading to differential adjustment of value estimates following outcomes that are better or worse than one’s expectations. Importantly, an RL algorithm with such valence-dependent learning rates estimates subjective values in a ‘risk-sensitive’ manner 61Mihatsch and Neuneier200267Niv et al.2012. A learner with a greater positive than negative learning rate will, across repeated choices, come to assign a greater value to a risky prospect (i.e., with variable outcomes) than to a safer choice with equivalent expected value (EV) that consistently yields intermediate outcomes, whereas a learner with the opposite asymmetry will estimate the risky option as being relatively less valuable.
Outcomes that violate our expectations might also be particularly valuable to remember. Beyond the central role of prediction errors in the estimation of action values, these learning signals also appear to influence what information is prioritized in episodic memory 34Ergo et al.2020. Past studies have demonstrated enhanced memory for stimuli presented concurrently with outcomes that elicit positive 26Davidow et al.201644Jang et al.2019, negative 47Kalbe and Schwabe2020, or high-magnitude (independent of valence) prediction errors 82Rouhani et al.2018, suggesting that prediction errors can facilitate memory encoding and consolidation processes. The common role of prediction errors in driving value-based learning and facilitating memory may reflect, in part, a tendency to allocate greater attention to stimuli that are uncertain 28Dayan et al.200070Pearce and Hall1980. However, it is unclear whether idiosyncratic valence asymmetries in RL computations might give rise to corresponding asymmetries in the information that is prioritized for memory. Moreover, while few studies have explored the development of these interactive learning systems, a recent empirical study observing an effect of prediction errors on recognition memory in adolescents, but not adults 26Davidow et al.2016, suggests that the influence of RL signals on memory may be differentially tuned across development.
In the present study, we examined whether valence asymmetries in RL change across adolescent development, conferring age differences in risk preferences. We additionally hypothesized that individuals’ learning asymmetries might asymmetrically bias their memory for images that coincide with positive versus negative prediction errors. Several past studies have characterized developmental changes in learning from valenced outcomes 18Christakou et al.201342Hauser et al.201545Jones et al.201459Master et al.202063Moutoussis et al.201896Bos et al.2012. However, the probabilistic reinforcement structures used in each of these studies demanded that the learner adopt specific valence asymmetries during value estimation in order to maximize reward in the task 68Nussenbaum and Hartley2019. For instance, in one study, child, adolescent, and adult participants were rewarded on 80% of choices for one option and 20% of choices for a second option 96Bos et al.2012. In this task, a positive learning asymmetry yields better performance than a neutral or negative asymmetry 68Nussenbaum and Hartley2019. Indeed, adults exhibited a more optimal pattern of learning, with higher positive than negative learning rates, while children and adolescents did not 96Bos et al.2012. Thus, choice behavior in these studies might reflect both potential age differences in the optimality of RL, as well as context-independent differences in the weighting of positive versus negative prediction errors 16Cazé and Meer201368Nussenbaum and Hartley2019.
In Experiment 1 of the present study, we assessed whether valence asymmetries in RL varied from childhood to adulthood, using a risk-sensitive RL task 67Niv et al.2012 in which probabilistic and deterministic choice options have equal EV, making no particular learning asymmetry optimal. This parameterization allows any biases in the weighting of positive versus negative prediction errors to be revealed through subjects’ systematic risk-averse or risk-seeking choice behavior. Each choice outcome in the task was associated with a trial-unique image, enabling assessment of whether valenced learning asymmetries also biased subsequent memory for images that coincided with good or bad outcomes.
To determine whether this hypothesized correspondence between valence biases in learning and memory generalized across experimental tasks and samples of different ages, in Experiment 2, we conducted a reanalysis of data from a previous study 82Rouhani et al.2018. In this study, a group of adults completed a task in which they reported value estimates for a series of images, and later completed a memory test for the images they encountered during learning. The original manuscript reported that subsequent memory varied as a function of PE magnitude, but not valence. Here, we tested whether a valence-dependent effect of PE on memory might be evident after accounting for idiosyncratic valence biases in learning.
Results
Experiment 1
source("twolines.R")

#this "two lines" approach was introduced by Simonsohn (2017), and helps us better understand quadratic patterns. Simonsohn argues that a quadratic pattern can have many shapes but to argue that something is u-shaped, we should be able to fit two regression lines to the data with a breakpoint between the two, and the two lines should have significant opposite-signed slopes

library(knitr)
library(tidyverse)
library(pander)
library(lme4)
library(lmerTest)
library(sjPlot)
library(dplyr)
library(car)
library(gridExtra)
library(reshape2)
library(ggpubr)
library(ggeffects)
library(here)
library(GGally)
library(emmeans)
library(sjmisc)
library(sjstats)
library(r2glmm)
library(effectsize)
library(plotrix)
library(gtable)
library(psych)
library(np)
library(ordinal)
library(formattable)
library(grid)

#reporting regression results

#These functions output statistics, including effect sizes, for each type of
#statistical test I report for display in html report created using knitr.

lmReport <- function(model) {
    cat(tab_model(model, show.stat = TRUE,
                         show.df = TRUE, string.stat = "t",
                         col.order = c("est", "ci",
                                       "stat","df.error","p"))$knitr,"\n--------\n")

    ftab <- effectsize::cohens_f(model, ci = .95)
    #square and round2 the parameter columns
    ftab[,2] <- round2(ftab[,2]^2,2)
    ftab[,4] <- round2(ftab[,4]^2,2)
    ftab[,5] <- round2(ftab[,5]^2,2)
    colnames(ftab) <- c("Parameter","Cohensf2Partial",
                        "f2_CI","f2_CI_low","f2_CI_high")
    return(ftab)
}

lmerReport <- function(model) {
    cat(tab_model(model, show.stat = TRUE,
                           show.df = TRUE, string.stat = "t",
                           col.order = c("stat","df.error","p",
                                         "est", "ci"))$knitr,"\n--------\n")
}

glmerReport <- function(model) {
    cat(tab_model(model, show.stat = TRUE,
                           show.df = TRUE, string.stat = "z",
                           col.order = c("stat","p","est", "ci"))$knitr,"\n--------\n")
}


## Custom round function
# Function to always round 0.5 up
round2 <- function(x, digits = 0) {
  posneg <- sign(x)
  z <- abs(x) * 10^digits
  z <- z + 0.5
  z <- trunc(z)
  z <- z / 10^digits
  z * posneg
}

## Function to compute BIC from AIC, nobs, nparams
compBIC <- function(AIC,nobs,nparams) {
    loglik <- (AIC - 2*nparams)/2
    BIC <- (2*loglik) + (nparams*log(nobs))
}
### Wide Files - one row per sub, not trial by trial ###
widedf <- read_csv("data_Exp1/widedf.csv")

#setting mean and sd age to use below because this isn't affected by other variables like number of trials, etc.
meanage <- mean(widedf$Age)
sdage <- sd(widedf$Age)
#z-score age
widedf$Age_Z <-(widedf$Age-meanage)/sdage

#model parameters
newModParams <- read_csv("data_Exp1/BestFitParams.csv")
newModParams$Age_Z <-(newModParams$Age-meanage)/sdage

### Long - trial-by-trial info derived from TDRS models  ###
#Load the long file with trial-by-trial memory performance and compute relevant variables
MemDF <- read_csv(here("data_Exp1","MemDF.csv"))

#z-score age
MemDF$Age_Z <-(MemDF$Age-meanage)/sdage

#dummy coding for forced trials
MemDF$Forced <- factor(ifelse(MemDF$TrialType == 2, 1, 0))

#dummy coding for equalEV risks
MemDF$EqEVRiskTrial <- factor(ifelse(MemDF$FullTrialType==1 |
                                         MemDF$FullTrialType==3, 1, 0))

#dummy coding for unequalEV risks
MemDF$UnEqEVRiskTrial <- factor(ifelse(MemDF$FullTrialType == 2, 1, 0))

#dummy coding for testTrials
MemDF$Test <- factor(ifelse(MemDF$TrialType == 3, 1, 0))

#dummy coding for equal vs unequal EV risky trials
MemDF$EqvsUnEqEVRiskTrial <- ifelse(MemDF$FullTrialType==1, 1,
                                    ifelse(MemDF$FullTrialType==3, 1,
                                           ifelse(MemDF$FullTrialType==2,
                                                  2, NaN)))

#dummy coding for equal vs unequal EV risky trials
MemDF$TrialTypeContrast <- factor(
    ifelse(MemDF$FullTrialType==1, 1,
           ifelse(MemDF$FullTrialType==3, 1,
                  ifelse(MemDF$FullTrialType==2, 2,
                         ifelse(MemDF$TrialType==2, 3,
                                ifelse(MemDF$TrialType==3, 4, NaN))))),
    levels = c("1","2","3","4"),
    labels = c("EqEVRisk", "UnEqEvRisk","Forced","Test"))

#Get the EV difference between machines for each problem
EVDiffTable <- read_csv(here("data_Exp1", "MachineEVs.csv"))

MemDF$EVDiff <- NA
MemDF$EVDiff <-  as.numeric(unlist(EVDiffTable[MemDF$FullTrialType,6]))
MemDF$EVDiffScale <-  scale(MemDF$EVDiff)
rm(EVDiffTable)


#Centering/scaling the memory trial index (when in the memory test a picture
#was presented)
MemDF$MemIdxScaled <- scale(MemDF$MemIdx)

#make PositiveRPE a factor
MemDF$PositiveRPE <-factor(MemDF$PositiveRPE,
                         levels = c(0,1),
                         labels = c("Negative Prediction Error",
                                    "Positive Prediction Error"))

#compute AI
MemDF$AsymmIdx <- (MemDF$AlphaPos-MemDF$AlphaNeg)/(MemDF$AlphaPos+MemDF$AlphaNeg)

#Unscaled Trial - created this after already creating analyses below that call
#on trialnum
MemDF$TrialUnscaled <- MemDF$TrialNum

#rescaling trial numbers
MemDF$TrialNum <- scale(MemDF$TrialNum)

#make block variable with 3 blocks
MemDF$Block <- ifelse(MemDF$TrialUnscaled<62, 1,
                      ifelse(MemDF$TrialUnscaled<123, 2, 3))

#make block variable with 6 blocks
MemDF$Block2 <- ifelse(MemDF$TrialUnscaled<31, 1,
                       ifelse(MemDF$TrialUnscaled<62, 2,
                              ifelse(MemDF$TrialUnscaled<92, 3,
                                     ifelse(MemDF$TrialUnscaled<123, 4,
                                            ifelse(MemDF$TrialUnscaled<153,
                                                   5, 6)))))


### Utility data

MemDF_Util <- read_csv(here("data_Exp1", "MemDF_Util.csv"))

#z-score age
MemDF_Util$Age_Z <-(MemDF_Util$Age-meanage)/sdage

#dummy coding for forced trials
MemDF_Util$Forced <- factor(ifelse(MemDF_Util$TrialType == 2, 1, 0))

#dummy coding for equalEV risks
MemDF_Util$EqEVRiskTrial <- factor(
    ifelse(MemDF_Util$FullTrialType==1 |
               MemDF_Util$FullTrialType==3, 1, 0))

#dummy coding for unequalEV risks
MemDF_Util$UnEqEVRiskTrial <- factor(
    ifelse(MemDF_Util$FullTrialType == 2, 1, 0))

#dummy coding for testTrials
MemDF_Util$Test <- factor(ifelse(MemDF_Util$TrialType == 3, 1, 0))

#dummy coding for equal vs unequal EV risky trials
MemDF_Util$EqvsUnEqEVRiskTrial <-
    ifelse(MemDF_Util$FullTrialType==1, 1,
           ifelse(MemDF_Util$FullTrialType==3, 1,
                  ifelse(MemDF_Util$FullTrialType==2, 2, NaN)))

#dummy coding for equal vs unequal EV risky trials
MemDF_Util$TrialTypeContrast <- factor(
    ifelse(MemDF_Util$FullTrialType==1, 1,
           ifelse(MemDF_Util$FullTrialType==3, 1,
                  ifelse(MemDF_Util$FullTrialType==2, 2,
                         ifelse(MemDF_Util$TrialType==2, 3,
                                ifelse(MemDF_Util$TrialType==3, 4, NaN))))),
    levels = c("1","2","3","4"),
    labels = c("EqEVRisk", "UnEqEvRisk","Forced","Test"))


#Get the EV difference between machines for each problem
EVDiffTable <- read_csv(here("data_Exp1", "MachineEVs.csv"))

MemDF_Util$EVDiff <- NA
MemDF_Util$EVDiff <-  as.numeric(
    unlist(EVDiffTable[MemDF_Util$FullTrialType,6]))
MemDF_Util$EVDiffScale <-  scale(MemDF_Util$EVDiff)
rm(EVDiffTable)


#Centering/scaling the memory trial index (when in the memory test a picture was presented)
MemDF_Util$MemIdxScaled <- scale(MemDF_Util$MemIdx)

#make RositiveRPE a factor
MemDF_Util$PositiveRPE <-factor(MemDF_Util$PositiveRPE,
                                levels = c(0,1),
                                labels = c("Negative Prediction Error",
                                           "Positive Prediction Error"))


#Unscaled Trial - created this after already creating analyses below that call on trialnum
MemDF_Util$TrialUnscaled <- MemDF_Util$TrialNum

#rescaling trial numbers
MemDF_Util$TrialNum <- scale(MemDF_Util$TrialNum)

#make block variable with 3 blocks
MemDF_Util$Block <- ifelse(MemDF_Util$TrialUnscaled<62, 1, ifelse(MemDF_Util$TrialUnscaled<123, 2, 3))

#make block variable with 6 blocks
MemDF_Util$Block2 <- ifelse(
    MemDF_Util$TrialUnscaled<31, 1,
    ifelse(MemDF_Util$TrialUnscaled<62, 2,
           ifelse(MemDF_Util$TrialUnscaled<92, 3,
                  ifelse(MemDF_Util$TrialUnscaled<123, 4,
                         ifelse(MemDF_Util$TrialUnscaled<153, 5, 6)))))


###Posterior predictive check data for RSTD
PPC <- read_csv(here("data_Exp1","PPC_RSTD.csv"))
#Keeping this separate because the parameters have the same names as those in
#widedf but are based on simulations. don't want to deal with renaming all of them
PPC$Age_Z <- scale(PPC$Age)

# PPC data for Utility
PPC_Util <- read_csv(here("data_Exp1","PPC_Util.csv"))

PPC_Util$Age_Z <- scale(PPC_Util$Age)

TDRecovDF <- read_csv(here("data_Exp1", 'ModelRecov_TD.csv'))
TDRSRecovDF <- read_csv(here("data_Exp1", 'ModelRecov_RSTD.csv'))
UtilRecovDF <- read_csv(here("data_Exp1", 'ModelRecov_Util.csv'))
FourLRRecovDF <- read_csv(here("data_Exp1", 'ModelRecov_FourLR.csv'))
Participants (N =
nrow(widedf)
min(widedf$Age)
max(widedf$Age)
round2(meanage,2)
round2(sdage,2)
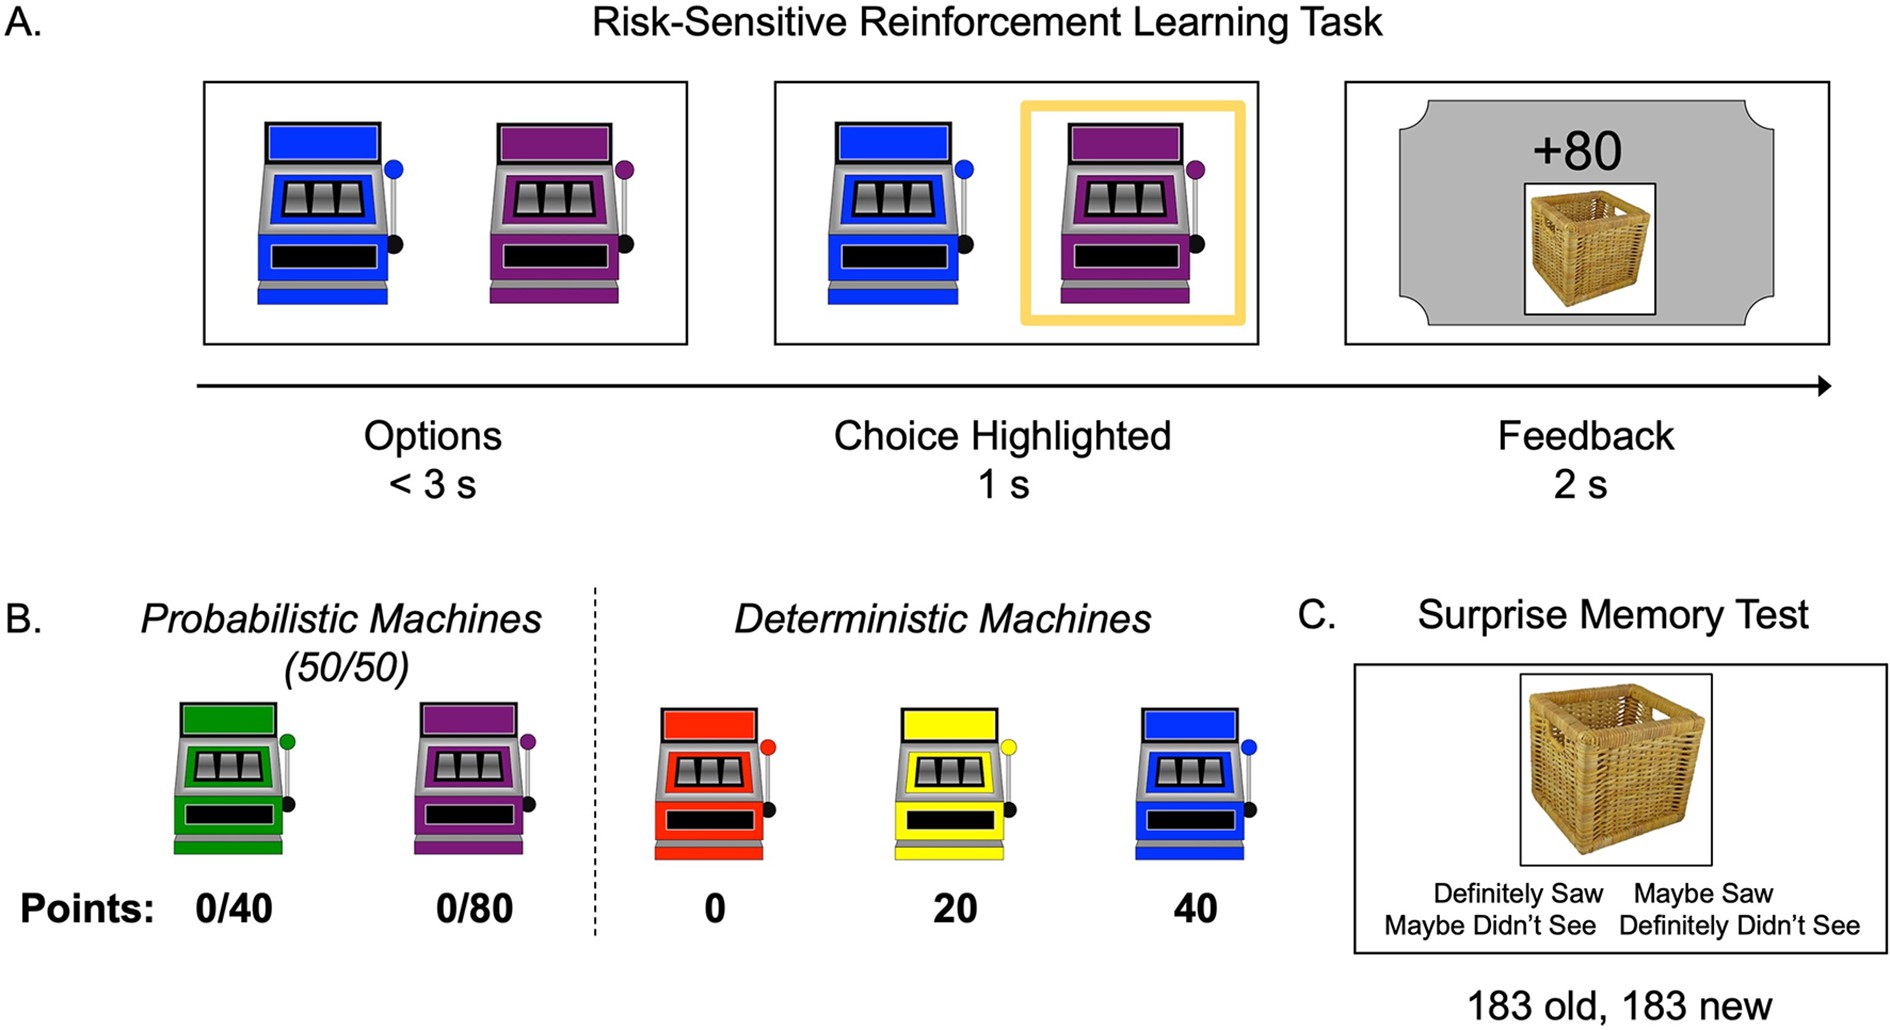
Task structure.
(A) Schematic of the structure of a trial in the risk-sensitive reinforcement learning task. (B) The probabilities and point values associated with each of five ‘point machines’ (colors were counterbalanced). (C) Example memory trial.
Test trial performance
To ensure that participants learned the probabilities and outcomes associated with each machine, we first examined performance on test trials, in which one option dominated the other. Test trial accuracy significantly improved across the task (generalized linear mixed-effects model: z = 8.56, p<0.001, OR = 2.03, 95% CI [1.72, 2.38]), with accuracy improving from a mean of 0.63 in the first block to means of 0.80 and 0.84 in blocks 2 and 3, respectively. There was no main effect of age (z = 0.51, p=0.612, OR = 1.06, 95% CI [0.86, 1.30]) or interaction between age and trial number (z = 0.22, p=0.830, OR = 1.02, 95% CI [0.87, 1.19]; Appendix 1—figure 1A). These results suggest that accuracy on this coarse measure of value learning did not change with age in our task.
print('Is there a relationship between age and WASI?')
WASIage <- lm(WASI~Age_Z, data = widedf)
lmReport(WASIage)

WASIagesq <- lm(WASI~Age_Z + I(Age_Z^2), data = widedf)
lmReport(WASIagesq)

print('There is no relationship between WASI and linear or quadratic age')
Explicit reports
Following the learning task, we probed participants’ explicit knowledge about the point machines. Consistent with participants’ high accuracy on test trials, accuracy was also high on participants’ reports of whether each point machine was probabilistic or deterministic (M = 0.85) and for the point values associated with each machine (M = 0.84). Linear regressions suggested that performance on these explicit accuracy metrics did not vary with linear age (probabilistic/deterministic response accuracy by age: b = –0.02, 95% CI [–0.06, 0.03], t(60) = –0.88, p=0.382, f2 = 0.01, 95% CI [0, 0.13]; point value response accuracy by age: b = 0.02, 95% CI [–0.04, 0.07], t(60) = 0.65, p=0.516, f2 = 0.01, 95% CI [0, 0.11]).
Response time
We explored whether response time (RT) varied with age during the learning task. We found a significant interaction between age and trial number (linear mixed-effects model: t(11279) = –2.10, p=0.036, b = –0.02, 95% CI [–0.04, 0]) predicting log-transformed RT. Although RT did not differ by age early in the experiment, older participants responded faster than younger participants by the end of the experiment.
Decision-making
Importantly, in our task, there were two pairs of machines in which both probabilistic and deterministic options yielded the same EV (i.e., 100% 20 points and 50/50% 0/40 points; 100% 40 points and 50/50% 0/80 points). A primary goal of this study was to examine participants’ tendency to choose probabilistic versus deterministic machines when EV was equivalent. On these equal-EV risk trials, participants chose the probabilistic option on 37% of trials (SD = 21%). This value was significantly lower than 50% (one-sample t-test: t(61) = 4.87, p<0.001, d = 0.62, 95% CI [0.37, 0.95]), suggesting that, despite exhibiting heterogeneity in risk preferences, participants as a group were generally risk averse.
Next, we tested whether choices of the probabilistic machines, compared to choices for equal-EV deterministic machines, changed with age. The best-fitting model included both linear and quadratic age terms (F(1,59) = 4.58, p=0.036), indicating that risk taking changed nonlinearly with age. Contrary to our hypothesis that risk-seeking choices would be highest in adolescents, we observed a significant quadratic effect of age, such that adolescents chose the probabilistic options less often than children or adults (quadratic age effect in a linear regression including both linear and quadratic age terms: b = 0.06, 95% CI [0, 0.12], t(59) = 2.14, p=0.036, f2 = 0.08, 95% CI [0, 0.29]; Figure 2; see Appendix 1—figure 1 for plots depicting risk taking across the task as a function of age). The linear effect of age was not significant (b = –0.01, 95% CI [–0.06, 0.12], t(59) = –0.44, p=0.662, f2 = 0.01, 95% CI [0, 0.11]). We also conducted a regression using the two-lines approach 90Simonsohn2018 and found a significant u-shaped pattern of risk taking with age, where the proportion of probabilistic choices decreased from age 8–16.45 (b = –0.03, z = –1.97, p=0.048) and increased from age 16.45–27 (b = 0.02, z = 1.98, p=0.048). Age patterns were qualitatively similar when considering the subset of trials in which participants faced choice options with unequal EV (i.e., the 0/80 point machine vs. the safe 20 point machine; see Appendix 1 and Appendix 1—figure 2 for full results).
ggplot(data=widedf, aes(x=Age, y=MeanRiskOverallEqEV)) +
    geom_point() +
    stat_smooth(method=lm,formula = y ~ x + I(x^2),se=TRUE,color="black") +
    scale_y_continuous(breaks=c(0,.25,.5,.75,1),
                       labels = c("0%","25%","50%","75%","100%"),
                       limits = c(0, 1)) +
    ylab("Percent Probabilistic Choices \nEqual-EV Trials") +
    geom_hline(yintercept=0.5, linetype="dashed") +
    theme_bw() +
    theme(text=element_text(family="sans",size=16),
          panel.grid.major = element_blank(),
          panel.grid.minor = element_blank())
Probabilistic choices by age.
Probabilistic (i.e., risky) choices by age on trials in which the risky and safe machines had equal expected value (EV). Data points depict the mean percentage of trials where each participant selected the probabilistic choice option as a function of age. The regression line is from a linear regression including linear and quadratic age terms (significant quadratic effect of age: b = 0.06, 95% CI [0, 0.12], t(59) = 2.14, p=0.036, f2 = .08, 95% CI [0, 0.29], N = 62). Shaded region represents 95% CIs for estimates.
Reinforcement learning modeling
To better understand the learning processes underlying individuals’ decision-making, we compared the fit of four RL models to participants’ choice behavior. The first was a temporal difference (TD) model with one learning rate (α). The second was a risk-sensitive temporal difference (RSTD) model with separate learning rates for better-than-expected (α+) and worse-than-expected (α-) outcomes, allowing us to index valence biases in learning. The third model included four learning rates (FourLR), with separate α+ and α- for free and forced choices, as past studies have found learning may differ as a function of agency 17Chambon et al.202021Cockburn et al.2014. Finally, the fourth model was a Utility model, which transforms outcome values into utilities with an exponential subjective utility function with a free parameter (ρ) capturing individual risk preferences 72Pratt1964, updated value estimates using a single learning rate. For all models, machine values were transformed to range from 0 to 1, and values were initialized at 0.5 (equivalent to 40 points). A softmax function with an additional parameter β was used to convert the relative estimated values of the two machines into a probability of choosing each machine presented for maximum likelihood estimation.
The RSTD (median Bayesian information criterion (BIC) = 131.93) and Utility (median BIC = 131.06) models both provided a better fit to participants’ choice data than both the TD (median BIC = 145.35) and FourLR (median BIC = 141.25) models (Appendix 1—figure 5). Assessment of whether the RSTD or Utility model provided the best fit to participants’ data was equivocal. At the group level, median ΔBIC was 0.87, while at the subject level, the median ΔBIC was 0.33. Thus, neither ΔBIC metric provides clear evidence in favor of either model (ΔBIC > 6 ; 77Raftery1995).
To further arbitrate between the RSTD and Utility models, we ran posterior predictive checks and confirmed that simulations from both models generated using subjects’ fit parameter values yielded choice behavior that exhibited strong correspondence to the real participant data (see Appendix 1—figure 9). However, data simulated from the RSTD model exhibited a significantly stronger correlation with actual choices (r = 0.92) than those simulated using the Utility model (r = 0.89; t(61) = 2.58, p=0.012). Because the RSTD model fit choice data approximately as well as the Utility model, provided a significantly better qualitative fit to the choice data, and yielded an index of valence biases in learning, we focused our remaining analyses on the RSTD model (see Appendix 1 for additional model comparison analyses and for an examination of the relation between the Utility model and subsequent memory data).
We computed an asymmetry index (AI) for each participant, which reflects the relative size of α+ and α-, from the RSTD model. Mean AI was –0.22 (SD = 0.50). Mirroring the age patterns observed in risk taking, a linear regression model with a quadratic age term fit better than the model with only linear age (F(1,59) = 5.88, p=0.018), and there was a significant quadratic age pattern in AI (b = 0.17, 95% CI [0.03, 0.31], t(59) = 2.43, p=0.018, f2 = 0.10, 95% CI [0, 0.33]; Figure 3). Further, the u-shaped relationship between AI and age was significant, with a decrease in AI from ages 8–17 (b = –0.08, z = –3.82, p<0.001), and an increase from ages 17–27 (b = 0.05, z = 2.17, p=0.030). This pattern was driven primarily by age-related changes in α-, which was greater in adolescents relative to children and adults (better fit for linear regression including quadratic term: F(1,59) = 9.04, p=0.004; quadratic age: b = –0.09, 95% CI [–0.16, –0.03], t(59) = –3.01, p=0.004, f2 = 0.15, 95% CI [0.02, 0.43]; Appendix 1—figure 10B). According to the two-lines approach, α- significantly increased from ages 8–18 (b = 0.04, z = 3.24, p=0.001) and decreased from ages 18–27 (b = –0.04, z = –3.57, p<0.001). Conversely, there were no linear or quadratic effects of age for α+ (all p_s>0.24; Appendix 1—figure 10A). Finally, there were no significant linear or quadratic age patterns in the β_ parameter (_p_s>.15, see Appendix 1 for full results; Appendix 1—figure 10C).
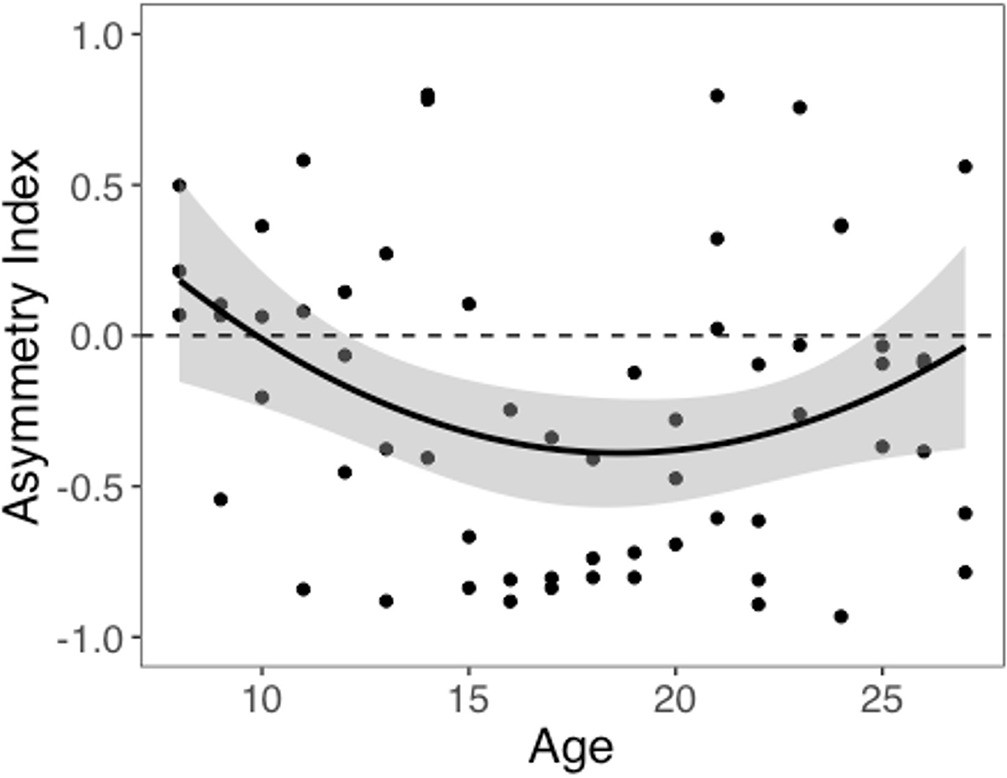
Asymmetry index (AI) by age.
The regression line is from a linear regression model including linear and quadratic age terms (b = 0.17, 95% CI [0.03, 0.31], t(59) = 2.43, p=0.018, f2 = 0.10, 95% CI [0, 0.33], N = 62). Data points represent individual participants. Shaded region represents 95% CIs for estimates.
Prior work has found that valence biases tend to be positive in free choices, but neutral or negative in forced choices 17Chambon et al.202021Cockburn et al.2014. While model comparison indicated that the FourLR model did not provide the best account of participants' learning process, we nonetheless conducted an exploratory analysis in which we used parameter estimates from the FourLR model to test whether learning asymmetries varied as a function of agency in our study. While the α+ and AI were both higher for free compared to forced trials, median AIs were negative for both free and forced choices (see Appendix 1 for full results; Appendix 1—figure 12).
Memory performance
Next, we examined accuracy during the surprise memory test for images that were presented with choice outcomes. Participants correctly identified 54% (SD = 14%) of images presented alongside choice feedback (i.e., Hits) and incorrectly indicated that 24% (SD = 15%) of foil images had been presented during the choice task (False Alarms). Mean d′ was 0.93 (SD = 0.48). Hit rate did not significantly change with linear or quadratic age (p_s>0.14). However, false alarm rate significantly increased with linear age (linear regression: _b = 0.04, 95% CI [0.00; 0.08], t(60) = 2.14, p=0.037, f2 = 0.08, 95% CI [0, 0.28]; Appendix 1—figure 3A). There was a marginal linear decrease in d′ with age (linear regression: b = –0.11, 95% CI [–0.23, 0.01], t(60) = 1.84, p=0.070, f2 = 0.06, 95% CI [0, 0.24]; Appendix 1—figure 3B), suggesting that adults performed slightly worse on the memory test than younger participants.
Influence of choice context on memory
We next tested whether the decision context in which images were presented influenced memory encoding. To explore this possibility, we first tested whether participants preferentially remembered images presented with outcomes of probabilistic versus deterministic machines. Participants were significantly more likely to remember pictures presented following a choice that yielded probabilistic rather than deterministic outcomes (probabilistic: M = 0.56, SD = 0.15; deterministic: M = 0.52, SD = 0.15; t(61) = 3.08, p=0.003, d = 0.39, 95% CI [0.13, 0.65]). This result suggests that pictures were better remembered when they followed the choice of a machine that consistently generated prediction errors (PEs), which may reflect preferential allocation of attention toward outcomes of uncertain choices 28Dayan et al.200070Pearce and Hall1980.
Next, we explored whether valence biases in learning could account for individual variability in subsequent memory. In theory, larger-magnitude PEs provide stronger learning signals. Thus, we hypothesized that participants would have better memory for items coinciding with larger PEs. We also expected that this effect might differ as a function of idiosyncratic valence biases, with participants preferentially remembering items coinciding with signed PEs where the sign was consistent with the valence bias of their AI. Of note, this model did not explicitly include a variable indicating whether outcomes followed probabilistic or deterministic choices. Rather, whether the choice was probabilistic or deterministic was reflected in the PE magnitude variable, which was typically higher for probabilistic choices. In a generalized linear mixed-effects model, we predicted memory accuracy as a function of AI, PE valence, PE magnitude, and their interaction. We also tested for effects of linear and quadratic age, false alarm rate, as a measure of participants’ tendency to generally deem items as old, and trial number in the memory task, to account for fatigue as the task progressed (Figure 4A). We had no a priori hypothesis about how any effect of valence bias on memory might interact with participants’ confidence in their ‘old’ and ‘new’ judgments. Therefore, consistent with prior research examining memory accuracy (e.g., 33Dunsmoor et al.2015; 65Murty et al.2016), we collapsed across ‘definitely’ and ‘maybe’ confidence ratings for our primary analysis (but see Appendix 1 for an exploratory ordinal regression analysis).
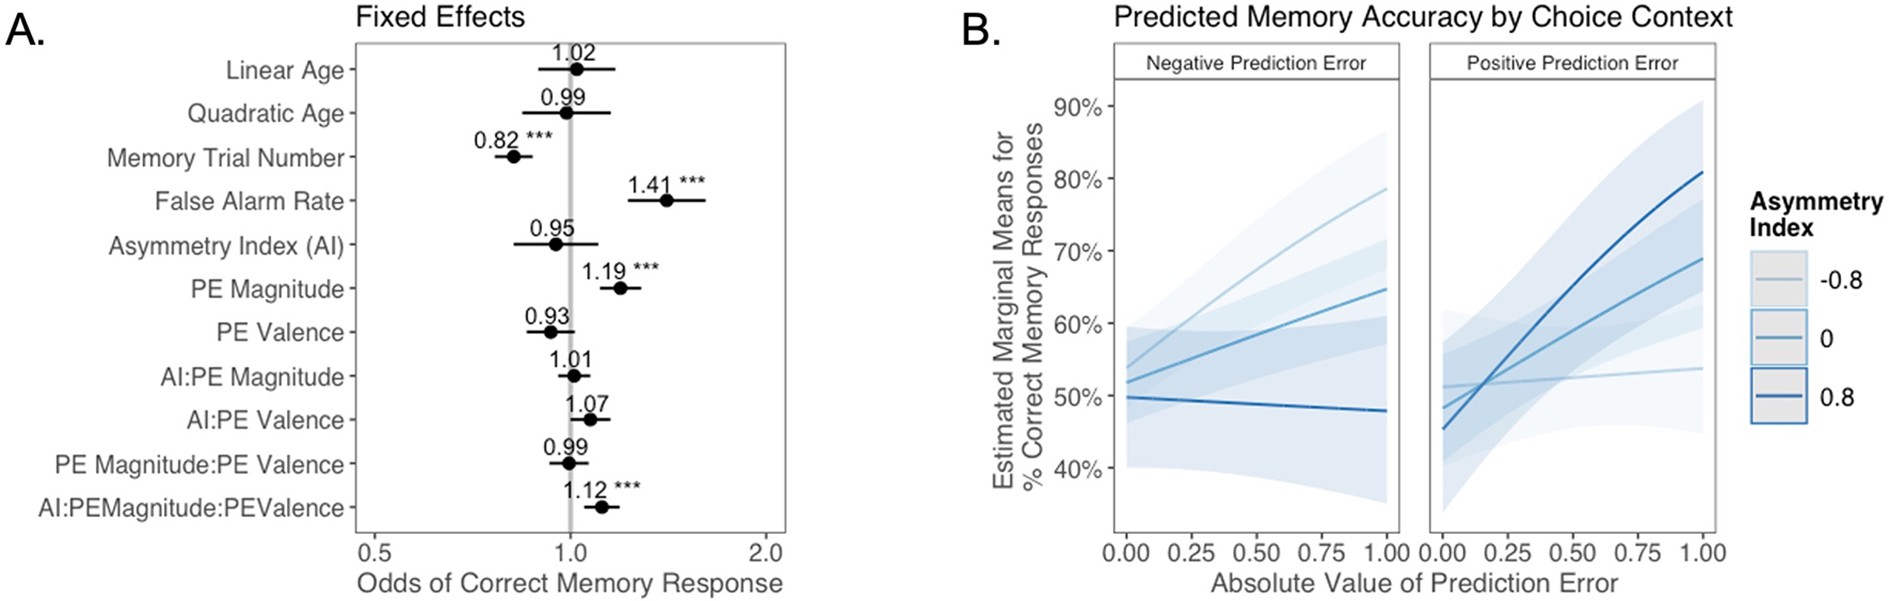
The relation between valence biases in learning and incidental memory for pictures presented with choice outcomes (Experiment 1).
(A) Results from generalized mixed-effects regression depicting fixed effects on memory accuracy. Whiskers represent 95% CI. (B) Estimated marginal means plot showing the three-way interaction between AI, PE valence, and PE magnitude (z = 3.45, p=0.001, OR = 1.12, 95% CI [1.05, 1.19], N = 62). Individuals with higher AIs were more likely to remember images associated with larger positive PEs, and those with lower AIs were more likely to remember images associated with larger negative PEs. Shaded areas represent 95% CI for estimates. ***p < .001.
As expected, accuracy was significantly higher for those with a higher false alarm rate (suggesting a bias towards old responses; z = 4.86, p<0.001, OR = 1.41, 95% CI [1.23, 1.61]), and accuracy decreased as the task progressed (main effect of memory trial number: z = –5.83, p<0.001, OR = 0.82, 95% CI [0.76, 0.87]). There was a significant effect of unsigned PE magnitude on memory (z = 4.75, p<0.001, OR = 1.19, 95% CI [1.11, 1.28]), such images that coincided with largerPEs were better remembered. There was also a significant three-way interaction between PE magnitude, PE valence, and AI on memory accuracy (z = 3.45, p=0.001, OR = 1.12, 95% CI [1.05, 1.19]), such that people with more positive AIs were more likely to remember images associated with larger positive PEs (Figure 4B). The converse was also true: those with lower AIs were more likely to remember images presented concurrently with outcomes that elicited higher-magnitude negative PEs. Ordinal regression results that considered all four levels of confidence in recollection judgments (Supplementary file 1, Appendix 1—figure 4) yielded consistent results and suggested that effects were primarily driven by high-confidence responses. Notably, neither linear (z = 0.32, p=0.750, OR = 1.02, 95% CI [0.89, 1.17]) nor quadratic age (z = –0.18, p=0.856, OR = 0.99, 95% CI [0.84, 1.15]) were significant predictors of memory, suggesting that AI parsimoniously accounted for individual differences in memory.
To test whether differences in memory for outcomes of deterministic versus probabilistic trials might have driven the observed AI × PE magnitude × PE valence interaction effect, we reran the regression model only within the subset of trials in which participants made probabilistic choices. Our results did not change — we observed both a main effect of PE magnitude (z = 2.22, p=0.026, OR = 1.11, 95% CI [1.01, 1.23], N = 62) and a significant PE valence × PE magnitude × AI interaction (z = 2.34, p=0.019, OR = 1.11, 95% CI [1.02, 1.21], N = 62).
Finally, we tested for effects of agency — whether an image coincided with the outcome of a free or forced choice — on memory performance. We did not find a significant main effect of agency on memory, and agency did not significantly modulate the AI × PE magnitude × PE valence interaction effect (see Appendix 1 for full results; Appendix 1—figure 13).
Self-reported risk taking
One possible explanation for our unexpected u-shaped relationship between age and risk preferences in our choice task is that the adolescents in our sample might have been atypically risk averse. To investigate this possibility, we examined the relation between age and self-reported risk taking to the Domain-Specific Risk Taking (DOSPERT) scale 9Blais and Weber2006. A linear regression model including quadratic age was a better fit than the model including linear age alone (F(1,59) = 9.55, p=0.003). Specifically, consistent with prior reports of increased self-reported risk taking in adolescents, we found a significant inverted u-shaped quadratic age pattern (Figure 5, b = –0.42, 95% CI [-0.69, –0.15], t(59) = –3.09, p=0.003, f2 = 0.16, 95% CI [0.02, 0.44]). There was not a significant linear age pattern in self-reported risk taking (b = 0.15, 95% CI [–0.09, 0.39], t(59) = 1.27, p=0.208, f2 = 0.04, 95% CI [0, 0.20]). A two-lines regression analysis indicated that risk taking increased until age 15.29 (b = 0.23, z = 2.20, p=0.028) and decreased thereafter (b = –0.09, z = –2.03, p=0.042). Despite the fact that both choices in our task and self-report risk taking exhibited nonlinear age-related changes, there was not a significant correlation between DOSPERT score and risk taking in the task (r = –0.12, 95% CI [–0.36, 0.13], t(60) = –0.95, p=0.347).

Self-reported risk taking by age.
Self-reported risk taking on the Domain-Specific Risk Taking (DOSPERT) scale changed nonlinearly with age (linear regression: b = –0.42, 95% CI [–0.69,–0.15], t(59) = –3.09, p=0.003, f2 = 0.16, 95% CI [0.02, 0.44], N = 62). Shaded region represents 95% CIs for estimates.
Experiment 2
Next, we assessed the generalizability of the observed effect of valence biases in learning on memory by conducting a reanalysis of a previously published independent dataset from a study that used a different experimental task in an adult sample 82Rouhani et al.2018. Notably, results from this study suggested that unsigned PEs (i.e., PEs of greater magnitude, whether negative or positive) facilitated subsequent memory, but no signed effect was observed. Here, we examined whether signed valence-specific effects might be evident when we account for individual differences in valence biases in learning.
Participants (N = 305) completed a Pavlovian learning task in which they encountered indoor and outdoor scenes. One type of scene had higher average value than the other. On each trial, an indoor or outdoor image was displayed, and participants provided an explicit prediction for the average value of that scene type. After the learning task, participants completed a memory test for the scenes.
To quantify valence biases in this task, we fit an ‘Explicit Prediction’ RL model that was similar to the RSTD model used in Experiment 1, but was fit to participants’ trial-by-trial predictions rather than to choices. Like RSTD, the Explicit Prediction model included α+ and α-, allowing us to quantify each participant’s AI based on the relative size of their best-fit α+ and α- parameters. Mean AI was –0.11 (SD = 0.34). Next, we ran a generalized linear mixed-effects model, as in Experiment 1, to examine whether PE valence and magnitude interacted with AI to predict subsequent memory, controlling for false alarm rate and memory trial number. Results are reported in Figure 6.
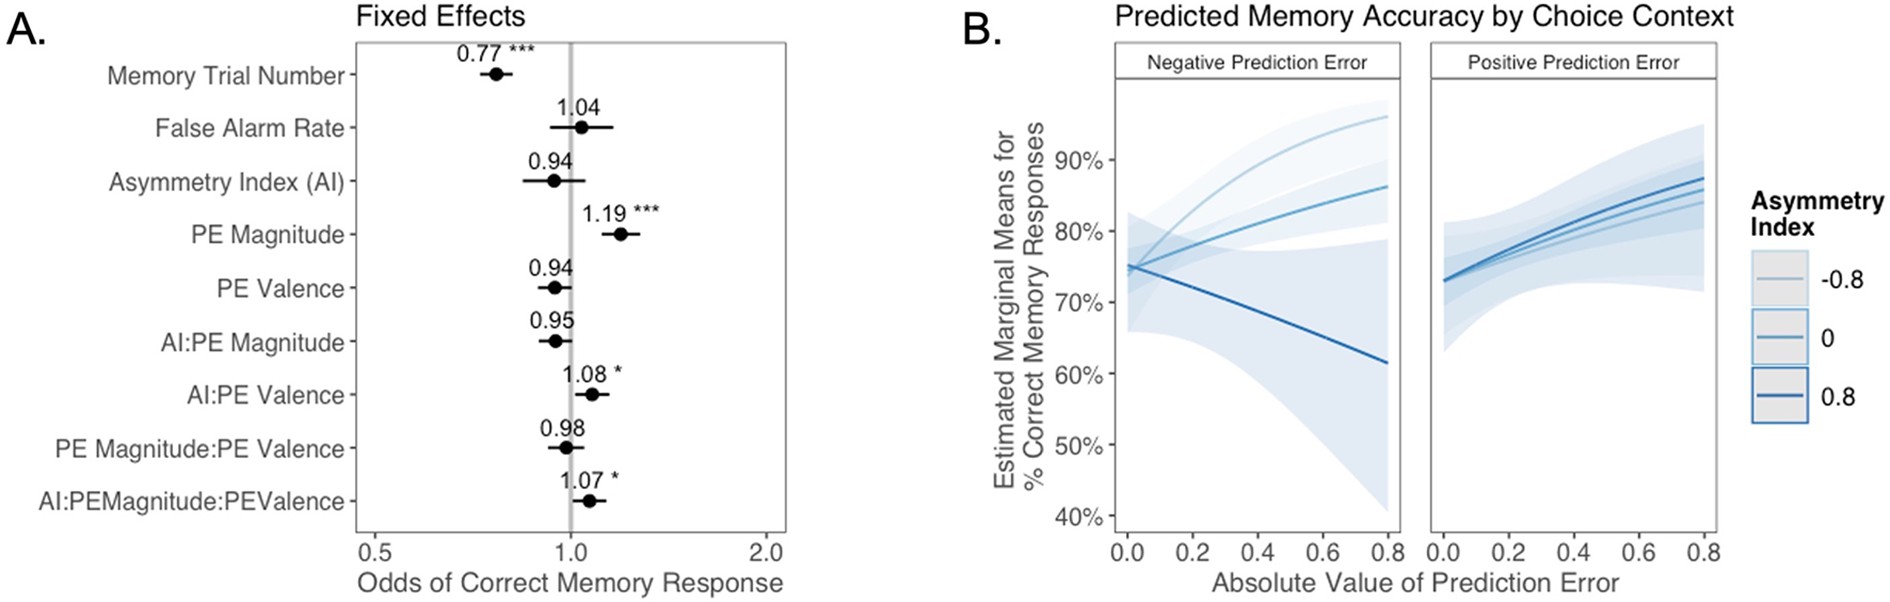
The relation between valence biases in learning and incidental memory for pictures presented with trial outcomes (Experiment 2).
Reanalysis of data from 82Rouhani et al.2018. (A) Results from generalized mixed-effects regression depicting fixed effects on memory accuracy. Whiskers represent 95% CI. (B) Estimated marginal means plot showing the three-way interaction between AI, PE valence, and PE magnitude (z = 2.19, p=0.029, OR = 1.07, 95% CI [1.01, 1.13], N = 305). Individuals with higher AIs were more likely to remember images associated with larger positive PEs, and those with lower AIs were more likely to remember images associated with larger negative PEs. Shaded areas represent 95% CI for estimates. *p < .05, ***p < .001.
Consistent with the results reported in the original manuscript 82Rouhani et al.2018, as well as the findings in Experiment 1, there was a strong main effect of unsigned PE (i.e., PE magnitude) on memory (z = 5.09, p<0.001, OR = 1.19, 95% CI [1.12, 1.28]). However, aligned with our results from Experiment 1, we also observed a significant three-way interaction between AI, PE magnitude, and PE valence (z = 2.19, p=0.029, OR = 1.07, 95% CI [1.01, 1.13]). Qualitative examination of this interaction effect suggests that the pattern of results differed slightly from that in Experiment 1. In Experiment 2, differences in memory performance as a function of AI were primarily apparent for images coinciding with negative PEs (Figure 6B): those who learned more from negative PEs also had better episodic memory for images that coincided with increasingly large negative PEs, while all participants appeared to have stronger memory for images coinciding with larger positive PEs. Notably, the interaction pattern here mirrors that within the subset of forced trials from Experiment 1 (Appendix 1—figure 13B) where, as in Experiment 2, participants learned from observed outcomes, but did not make free choices. One possibility is that PE magnitude and PE valence enhance memory through separate mechanisms, with a universal positive effect of unsigned PEs but a contextually (depending on choice agency) and individually variable effect of PE valence.
Discussion
In this study, we examined whether asymmetry in learning from good versus bad choice outcomes changed across adolescence, and whether valence biases in RL also influenced episodic memory encoding. Specifically, we hypothesized that adolescents would place greater weight on good than bad outcomes during learning, a potential cognitive bias that may contribute to the increased risk taking during adolescence evident in real-world epidemiological data 48Kann et al.2018. We indeed observed nonlinear age differences in valence-based learning asymmetries, but in the direction opposite from our prediction. Adolescents learned more from outcomes that were worse than expected, which was reflected in less risk taking relative to children and adults. Within this developmental sample, individual differences in learning biases were mirrored in subsequent memory. People who learned more from surprising negative versus positive outcomes also had better memory for images that coincided with negative outcomes, and vice versa. Although the precise pattern of results differed slightly, this relation between idiosyncratic valence biases in RL and corresponding biases in subsequent memory was also evident in a second independent sample in a different task 82Rouhani et al.2018, suggesting that this finding is generalizable. Collectively, these results highlight age-related changes across adolescence in the computation of subjective value and demonstrate that an individually varying valence asymmetric valuation process also influences how information is prioritized in memory.
Age-related shifts in learning rate asymmetry were driven primarily by changes in negative, rather than positive, learning rates. Whereas negative learning rates changed nonlinearly with age, there was no evidence for significant age differences in positive learning rates. This absence of age-related change in reward learning may seem counterintuitive given a large literature characterizing heightened reward sensitivity in adolescence (for reviews, see 39Galván2013; 89Silverman et al.2015; 98Duijvenvoorde et al.2016); however, these effects have largely been observed in tasks in which learning was not required. Moreover, heightened reactivity to negatively valenced stimuli has also been observed in adolescents, relative to children 59Master et al.2020 and adults 40Galván and McGlennen2013, and adolescents have been found to exhibit greater sensitivity to negative social evaluative feedback than adults 78Rodman et al.2017. While a relatively small number of studies have used RL models to characterize age-related changes in valence-specific value updating 18Christakou et al.201342Hauser et al.201545Jones et al.201459Master et al.202063Moutoussis et al.201896Bos et al.2012, age patterns reported in these studies vary substantially and none observed the same pattern of valence asymmetries present in our data. Variability in these findings may be due in part to substantial variation in the task reward structures, each of which required specific asymmetric settings of learning rates in order to perform optimally 16Cazé and Meer201368Nussenbaum and Hartley2019. This task variation limits the ability to differentiate age differences in optimal learning from systematic age differences in the influence of positive versus negative prediction errors on subjective value computation 68Nussenbaum and Hartley2019. In contrast, our study used a paradigm in which risky and safe options had equal EV, allowing us to index risk preferences and corresponding valence biases in a context where there was no optimal strategy. Given the lack of convergence in the literature to date, further studies characterizing valence asymmetries in learning using unconfounded measures will be needed to ascertain how broadly the biases we observed generalize to learning contexts with varying reward statistics (e.g., different outcome probabilities or outcomes that are truly negative instead of neutral).
Across two experimental samples, participants’ idiosyncratic tendencies to place greater weight on outcomes that elicited either positive or negative prediction errors was, in turn, associated with a propensity to form stronger incidental memories for images paired with these outcomes during learning. This correspondence between valence biases in evaluation and in memory is consistent with past findings. Greater risk-seeking choice behavior has been associated with better memory for the magnitude of extreme win outcomes 55Ludvig et al.2018 as well as greater recalled frequency of win outcomes 57Madan et al.201458Madan et al.2017, whereas risk-averse choices have been associated with the opposite pattern. Our results extend these findings by linking individual risk preferences to an underlying learning algorithm that predicts the valence specificity of corresponding memory biases and by demonstrating that these biases extend to episodic features incidentally associated with valenced outcomes. Moreover, while several prior studies employing computational analyses of learning have variably observed enhanced memory for images coinciding with outcomes that elicit positive 26Davidow et al.201644Jang et al.2019, negative 47Kalbe and Schwabe2020, or high-magnitude (independent of valence) PEs 82Rouhani et al.201883Rouhani and Niv2019, our findings suggest that consideration of individual differences in the prioritization of positive versus negative PEs may be critical in understanding how these aspects of value-based learning signals relate to memory encoding.
Attention likely played a critical role in the observed learning and memory effects. Although our study did not include direct measures of attention, there is a large literature demonstrating the critical role of attention in both RL 28Dayan et al.200043Holland and Schiffino201670Pearce and Hall198075Radulescu et al.2019 and memory formation 20Chun and Turk-Browne2007. Prominent theoretical accounts have proposed that attention should be preferentially allocated to stimuli that are more uncertain 28Dayan et al.200070Pearce and Hall1980. In our study, memory was better for items that coincided with probabilistic compared to deterministic outcomes. This finding likely reflects greater attention to the episodic features associated with outcomes of uncertain choice options. Importantly, however, our memory findings could not be solely explained via an uncertainty-driven attention account as the relation between idiosyncratic asymmetric valence biases and memory was also evident within the subset of trials with probabilistic outcomes. Thus, our observed memory effects may reflect differential attention to valenced outcomes that varies systematically across individuals in a manner that can be accounted for by asymmetries in their learning rates. Such valence biases in attention have been widely observed in clinical disorders 2Bar-Haim et al.200762Mogg and Bradley2016 and may also be individually variable within non-clinical populations.
In Experiment 1 of the present study, participants observed the outcomes of both free and forced choices. Prior studies have demonstrated differential effects of free versus forced choices on both learning and memory 17Chambon et al.202021Cockburn et al.201449Katzman and Hartley2020, which may reflect greater allocation of attention to contexts in which individuals have agency. Valence asymmetries in learning have been found to vary as a function of whether choices are free or forced, such that participants tend to exhibit a greater positive learning rate bias for free than for forced choices 17Chambon et al.202021Cockburn et al.2014. Here, we did not observe positive learning rate asymmetries for free choices, and a model that included separate valenced learning rates for free versus forced choices was not favored by model comparison. Studies have also found that subsequent memory is facilitated for images associated with free, relative to forced, choices 49Katzman and Hartley202064Murty et al.2015. In Experiment 1, there was no significant effect of agency on memory. However, in Experiment 2, in which participants provided explicit predictions of choice outcomes, but did not make free choices, the qualitative pattern of learning and memory biases differed from that observed in Experiment 1, and closely resembled the pattern present within the subset of forced-choice trials from that experiment. Namely, in each of these conditions where participants were not able to make free choices, all participants, regardless of AI, exhibited better memory for images presented with large positive PEs. Thus, while our study was not explicitly designed to test for such effects, this preliminary evidence suggests that choice agency may modulate the relation between valence biases in learning and corresponding biases in long-term memory, a hypothesis that should be directly assessed in future studies.
While one interpretation of our results is that asymmetric value updating influences the prioritization of events in memory, recent theoretical proposals 8Biderman et al.202053Lengyel and Dayan200887Shadlen and Shohamy2016 and empirical findings 1Bakkour et al.201911Bornstein et al.201732Duncan et al.2019 suggest a potential alternative account. According to this work, sampling of specific valenced episodes from memory can influence decision-making and serve as a different way of making choices under uncertainty than the sort of incremental value computation formalized in RL models. Under this conceptualization, a tendency to preferentially encode or retrieve past positive or negative experiences may, in turn, drive risk-averse or risk-seeking choice biases. While our task design does not enable clear arbitration between these alternative directional hypotheses, our results provide additional evidence of a tight coupling between valuation and episodic memory, and further underscore the importance in examining individual differences in valence asymmetries in these processes.
Traditional behavioral economic models of choice suggest that risk preferences stem from a nonlinear transformation of objective value into subjective utility 7Bernoulli195446Kahneman and Tversky1979, with decreases in the marginal utility produced by each unit of objective value (i.e., a concave utility curve) producing risk aversion. Our present study was motivated by the insight that such risk-averse, or risk-seeking, preferences can also arise from an RL process that asymmetrically integrates valenced prediction errors 61Mihatsch and Neuneier200267Niv et al.2012. In Experiment 1, we fit both a traditional behavioral economic model with exponential subjective utilities as well as a model with valenced learning rates. Notably, there was a very close correspondence between learning asymmetries derived from the valenced learning rate model and the risk preference parameter from the utility model, and model comparison indicated that these models provided comparably good accounts of participants’ choice data. Thus, future research will be needed to arbitrate between utility and valenced learning rate models of decisions under risk. However, a potential parsimonious account is that a risk-sensitive learning algorithm could represent a biologically plausible process for the construction of risk preferences 25Dabney et al.2020, in which distortions of value are produced through differential subjective weighting of good and bad choice outcomes 61Mihatsch and Neuneier200267Niv et al.2012.
Contrary to our a priori hypothesis, and to epidemiological 48Kann et al.201893Steinberg2013 and theoretical 15Casey et al.200856Luna200992Steinberg2008 work suggesting that adolescence is a period of increased risk taking, we found that adolescents took fewer risks than children or adults in our task. While at first glance these results might appear anomalous, within the same sample, we found that adolescents reported greater real-world risk taking than both children and adults. This lack of correspondence between task-based and self-reported indices of risk taking is consistent with previous findings in adults 76Radulescu et al.2020, and suggests that these two measures reflect separable constructs. Past empirical studies assessing developmental changes in risky choice in laboratory tasks have observed varied results 30Defoe et al.201579Rosenbaum et al.201880Rosenbaum and Hartley2019, but highlight two potential features of tasks that may elicit heightened adolescent risk taking. Adolescents may be more likely to take risks in tasks that require learning about risk through experience versus explicit description 79Rosenbaum et al.2018, and in which the probabilistic negative outcomes are rare (e.g., the Iowa Gambling Task; 6Bechara et al.1997), qualities that are also true of many real-world risk-taking contexts. While our task involved experiential learning, risky choices resulted in rewarding outcomes on half of the trials and non-win outcomes on the other half. Thus, undesirable outcomes were not rare and there were no true negative outcomes. Highlighting the important influence of such contextual features on decision-making across development, a recent study found that adolescents were more prone than adults to ‘underweight’ rare outcomes in decision-making relative to their true probabilities, conferring a greater propensity to take risks in situations where rare outcomes are unfavorable 81Rosenbaum et al.2021. Collectively, these findings suggest that specific details of an experimental design may influence the age-related patterns of risk taking observed in laboratory tasks 80Rosenbaum and Hartley2019 and suggest that greater ecological validity of task designs might be best achieved by mirroring the key statistical properties of real-world decision contexts of interest.
The present findings raise the suggestion that, for a given individual, valence asymmetries in value-based learning might become more negative from childhood into adolescence, and more positive from adolescence into young adulthood. However, an important caveat is that such patterns of developmental change cannot be validly inferred from cross-sectional studies, which are confounded by potential effects of cohort 86Schaie1965. Past studies have demonstrated that valence asymmetries in RL are indeed malleable within a given individual, exhibiting sensitivity to the statistics of the learning environment (e.g., the informativeness of positive versus negative outcomes; 73Pulcu and Browning2017) as well as to endogenous manipulations such as the pharmacological manipulation of neuromodulatory systems 60Michely et al.2020. Future longitudinal studies will be needed to definitively establish whether valence biases in learning exhibit systematic age-related changes within an individual over developmental time.
Adolescence is conventionally viewed as a period of heightened reward-seeking, begging the question of why adolescents might exhibit the strongest negative valence bias in learning and memory. Theoretical consideration of the adaptive role of valence asymmetries may provide a parsimonious resolution to this apparent contradiction 16Cazé and Meer2013. Somewhat counterintuitively, greater updating for negative versus positive prediction errors (i.e., a negative valence bias) yields systematic distortions in subjective value that effectively increase the contrast between outcomes in the reward domain (e.g., a participant with a negative learning asymmetry will represent the risky 80- and 40-point machines as being more different from each other than a participant with a positive learning asymmetry), facilitating optimal reward-motivated action selection. This tuning of learning rates is particularly beneficial in environments in which potential rewards are abundant 16Cazé and Meer2013, which may be true during adolescence when social elements of the environment acquire unique reward value 10Blakemore200866Nardou et al.2019. While negative valence biases may be adaptive for reward-guided decision-making, a propensity to form more persistent memories for negative outcomes may also contribute to adolescents’ heightened vulnerability to psychopathology 51Lee et al.201469Paus et al.2008. A recent study using computational formalizations found that adults who were biased toward remembering images associated with negative, relative to positive, prediction errors also exhibited greater depressive symptoms 83Rouhani and Niv2019. Moreover, negative biases in real-world autobiographical memory are a hallmark of depression and anxiety in both adolescents 50Kuyken and Howell2006 and adults 31Dillon and Pizzagalli201837Gaddy and Ingram2014. Future research should examine how valence biases in learning and memory, as well as the reward statistics of an individual’s real-world environment, relate to vulnerability or resilience to psychopathology across adolescent development. Finally, given an extensive literature demonstrating the pronounced influence of neuromodulatory systems on both valence biases in RL 24Cox et al.201535Frank et al.200436Frank et al.200760Michely et al.2020 and value-guided memory 54Lisman and Grace200584Sara2009, future studies might examine how developmental changes within these systems relate to the age-related shifts in valence biases observed here.
Materials and methods
Experiment 1
Participants
Sixty-two participants ages 8–27 years were included in our final sample (mean age = 17.63, SD = 5.76, 32 females). Nine additional participants completed the study but were removed from the sample due to poor task performance (described further below). This sample size is consistent with prior studies that used age as a continuous predictor and have found significant age differences in decision-making (e.g., 29Decker et al.2015; 71Potter et al.2017; 97Bos et al.2015). All participants had no previous diagnosis of a learning disorder, no current psychiatric medication use, and normal color vision according to self- or parent report.
Risk-sensitive RL task
In the present study, participants completed a risk-sensitive RL task adapted from 67Niv et al.2012 in which participants learned, through trial and error, the values and probabilities associated with five ‘point machines’ (Figure 1A). Three machines were deterministic and gave their respective payoffs 100% of the time (Figure 1B). Two machines were probabilistic (or risky) and gave their respective payoffs 50% of the time and zero points the other 50% (Figure 1B). Importantly, EV could be deconfounded from risk as there were two pairs of machines in which both probabilistic and deterministic options yielded the same EV (i.e., 100% 20 points and 50/50% 0/40 points; 100% 40 points and 50/50% 0/80 points). We presented each choice outcome on a ‘ticket’ that also displayed a trial-unique picture of an object. A subsequent memory test allowed us to explore the interaction between choice outcomes and memory encoding across age. The task was programmed in MATLAB Version R2017a (The MathWorks, Inc, Natick, MA).
All participants completed a tutorial that involved detailed instructions and practice trials with machines that had the same probability structure as the machines they would encounter in the later task (i.e., one machine always gave 1 point, the other gave 0 point on half of trials and 2 points on the other half). Then, participants completed the RL task, which included 183 trials. There were 66 total ‘risky’ choices between probabilistic and deterministic machines. 42 of these risky trials involved choices between machines with equal EV, while 24 trials required choices between the probabilistic 0/80 machine and the deterministic 20 point machine. Participants also experienced 75 single-option ‘forced’ trials (15 for each of the five machines) to ensure each participant learned about values and probabilities associated with all of the machines. During forced trials, only one machine appeared on the screen, and the participant pressed a button to indicate the location of the machine (left or right). Finally, there were 42 test trials in which one machine’s value had absolute dominance over the other, with all outcomes of one option being greater than or equal to all outcomes of the other option (e.g., 100% chance of 40 points versus 50% of 40 points and 50% of 0 points). Test trials allowed us to gauge participants’ learning and understanding of the task. We excluded nine participants who did not choose correctly on at least 60% of test trials in the last 2/3 of the task (four children ages 8–9, three adolescents ages 14–16, and two adults ages 24–25). The trials were divided into blocks with 1/3 of the trials in each block, and after each block, participants could choose to take a short break. Unbeknownst to participants, trials were pseudo-randomized, such that 1/3 of each type of trial was presented in each block of the task, with the order of trial types randomized within each block. Outcomes of risky machines were additionally pseudo-randomized so that within each series of eight choices from a given risky machine, four choices resulted in a win and four resulted in zero point, in a random order.
On each trial, participants were asked to make a choice within 3 s after the machines were presented. If they chose in time, the outcome of the choice was presented on a ‘ticket’ along with a randomly selected, trial-unique picture of an object for 2 s (Figure 1A). If they did not respond in time, the words ‘TOO SLOW’ were presented, without a picture, for 1 s before the task moved to the next trial. Across all participants, only 37 (out of 11,346) total trials were missed for slow responses, with a maximum of 7 missed trials for one participant.
After completing the choice task, participants were probed for their explicit memory of points associated with each machine. For every machine, a participant was first asked, “Did this machine always give you the same number of points, or did it sometimes give 0 points and sometimes give you more points?” If the participant indicated that the machine always gave the same number of points, they were asked, “How many points did this machine give you each time you chose it?” Otherwise, they were asked, “How many points did this machine give you when it did not give 0 points?” To respond to this second question, participants selected from all possible point outcomes presented in the task (0, 20, 40, 80). There was no time limit for responding to these questions.
Next, participants completed a surprise memory test, in which all 183 images presented during the task and 183 novel images were presented in random order (Figure 1C). Images corresponding to the few choice trials that were missed due to slow responses were recategorized as novel. Ratings were on a scale from 1 (definitely saw during the task) to 4 (definitely did not see during the task), and participants had unlimited time to indicate their responses. All images were obtained from the Bank of Standardized Stimuli (BOSS; 13Brodeur et al.2010; 14Brodeur et al.2014) and were selected to be familiar and nameable for the age range in our sample. For each participant, half of the set of photos was randomly chosen to be presented during the task and half were assigned to be novel images for the memory test.
Self-reported risk taking
To assess the predictive validity of our findings for real-world risk taking, participants completed the DOSPERT scale 9Blais and Weber2006. The DOSPERT indexes participants’ likelihood of taking risks in five domains: monetary, health and safety, recreational, ethical, and social. We computed the mean self-reported likelihood of risk taking across all behaviors on the DOSPERT as a measure of real-world risk taking. Age-appropriate variants of the DOSPERT were administered to children (8–12 years old), adolescents (13–17 years old), and adults (ages 18 and older) 3Barkley-Levenson et al.201391Somerville et al.201798Duijvenvoorde et al.2016.
Reasoning assessment
We administered the Vocabulary and Matrix Reasoning sections of the Wechsler Abbreviated Scale of Intelligence (WASI; 101Wechsler2011), which index verbal cognition and abstract reasoning, to ensure that these measures were not confounded with age within our sample. WASI scores did not vary by linear or quadratic age (_p_s>.2). Thus, we did not include this measure in subsequent analyses.
Procedure
Participants first provided informed consent (adults) or assent and parental consent (children and adolescents). Next, participants completed the risk-sensitive RL task and memory test, followed by the DOSPERT questionnaire and the WASI. Participants were paid $15 for completing the experiment, which lasted approximately 1 hr. Although participants were told that an additional bonus payment would be based on the number of points they earned in the risk-sensitive RL task, all participants received the same $5 bonus payment. The study protocol was approved by the New York University Institutional Review Board.
Analyses
Reinforcement-learning models
Four RL models were fit to participants’ choices in the task.
TD model
We fit a TD learning model 94Sutton and Barto1998, in which the estimated value of choosing a given machine (QM) is updated on each trial (t) according to the following function: QM(t + 1) = QM(t) + α * δ(t), in which δ(t) = r(t) – QM(t) is the prediction error, representing how much better or worse the reward outcome (r) is than the estimated value of that machine. δ is scaled by a learning rate α, a free parameter that is estimated separately for each participant.
RSTD model
The RSTD model is similar to the TD model but includes two separate learning rates for prediction errors of different signs. Specifically, when δ is positive, the value of the chosen machine is updated according to the equation: QM(t + 1) = QM(t) + α+ * δ(t). When δ is negative, the chosen machine’s value is updated as QM(t + 1) = QM(t) + α- * δ(t). Including two learning rates allows the model to be sensitive to the risk preferences revealed by participants’ choices across the probabilistic and deterministic (‘risky versus safe’) choice pairs in the paradigm 67Niv et al.2012. For a given individual, if α+ is greater than α-, Q-values of the machines with variable outcomes will be greater than those of deterministic machines with equal EV, and the individual will be more likely to make risk-seeking choices. Conversely if α- is greater than α+, the Q-values of the risky machines will be lower than their EVs, making risk-averse choices more likely. To index the relative difference between α+ and α-, we computed an AI as AI = (α+ - α-)/(α+ + α-), where an AI > 0 reflects greater weighting of positive relative to negative prediction errors, whereas an AI < 0 reflects greater relative weighting of negative prediction errors 67Niv et al.2012.
FourLR model
In our task, participants made both free and forced choices. Past research suggests that valence biases in learning may differ as a function of choice agency 17Chambon et al.202021Cockburn et al.2014. To test this possibility, we assessed the fit of a FourLR model, which was the same as the RSTD model except that it included four learning rates instead of two, with separate α+ and α- parameters for free and forced choices.
Utility model
As a further point of comparison with the TD, RSTD, and FourLR models, we estimated a utility model that employed the same value update equation as the TD model, QM(t + 1) = QM(t) + α * δ(t). However, δ was defined according to the equation δ(t) = r(t)ρ – QM(t), in which the reward outcome is exponentially transformed by ρ, which represents the curvature of each individual’s subjective utility function 72Pratt1964. ρ < 1 corresponds to a concave utility function, which yields risk aversion as a result of diminishing sensitivity to returns 95Tversky and Kahneman1992. In contrast, ρ > 1 corresponds to a convex utility function that yields risk-seeking behavior.
In all models, Q-values were converted to probabilities of choosing each option in a trial using the softmax rule, PM1 = eβ*Q(t)M1/(eβ*Q(t)M1+ eβ*Q(t)M2), where PM1 is the predicted probability of choosing Machine 1, with the inverse temperature parameter β capturing how sensitive an individual’s choices are to the difference in value between the two machines. Notably, outcomes of the forced trials were included in the value updating step for each model. However, forced trials were not included in the modeling stage in which learned values are passed through the softmax function to determine choice probabilities as there was only a single-choice option on these trials.
Model fitting
Prior to model fitting, outcome values were rescaled between 0 and 1, with 1 representing the maximum possible point outcome (80). We fit all RL models for each participant via maximum a posteriori estimation in MATLAB using the optimization function fminunc. _Q-_values were initialized at 0.5 (equivalent to 40 points). Bounds and priors for each of the parameters are listed in Table 1. There was no linear or quadratic relationship between BIC and age in any of the models (all _p_s>0.1).
| Model | Parameter | Bounds | Prior | Recoverability |
|---|---|---|---|---|
| TD | α | 0,1 | Beta(2,2) | 0.84 |
| β | 0.000001, 30 | Gamma(2,3) | 0.88 | |
| RSTD | α+ | 0,1 | Beta(2,2) | 0.79 |
| α- | 0,1 | Beta(2,2) | 0.88 | |
| β | 0.000001, 30 | Gamma(2,3) | 0.9 | |
| FourLR | α+ free | 0,1 | Beta(2,2) | 0.79 |
| α- free | 0,1 | Beta(2,2) | 0.89 | |
| α+ forced | 0,1 | Beta(2,2) | 0.76 | |
| α- forced | 0,1 | Beta(2,2) | 0.78 | |
| β | 0.000001, 30 | Gamma(2,3) | 0.9 | |
| Utility | α | 0,1 | Beta(2,2) | 0.75 |
| β | 0.000001, 30 | Gamma(2,3) | 0.88 | |
| ρ | 0, 2.5 | Gamma(1.5,1.5) | 0.88 |
Parameter and model recovery
For each model, we simulated data for 10,000 subjects with values of each parameter drawn randomly and uniformly from the range of possible parameter values. Next, we fit the simulated data using the same model. We tested for recoverability of model parameters by correlating the parameter that generated the data with the parameters produced through model fitting. These correlations are displayed in Table 1. All parameters for TD, RSTD, FourLR, and Utility models showed high recoverability.
To examine the identifiability of the TD, RSTD, FourLR, and Utility models, we generated simulated data using each model and fit all four of the models, including those that were not used to generate the data to each simulated dataset (e.g., we fit all the TD-generated subjects with the TD model as well as the RSTD, FourLR, and Utility models). We then used BIC, a quality-of-fit metric that penalizes models for additional parameters, to assess whether the generating model was also the best-fitting model for each subject. Recoverability was reasonable for all models except the least-parsimonious FourLR model (Table 2). Aside from the subjects generated by the FourLR model, for all pairwise comparisons between generating and comparison models, the majority of simulated subjects were best fit by the generating model. The RSTD-simulated subjects who were better fit by the TD model were those who had less extreme AI values (Appendix 1—figure 7), and thus could be more parsimoniously captured by a model with a single learning rate. We also found that RSTD model parameters were reasonably well recovered across the range of AI observed in our empirical sample (see Appendix 1—figure 8).
| Comparison model | |||||
|---|---|---|---|---|---|
| TD | RSTD | FourLR | Utility | ||
| Generating model | TD | - | 0.98 | 1 | 0.97 |
| RSTD | 0.57 | - | 0.99 | 0.65 | |
| FourLR | 0.5 | 0.31 | - | 0.39 | |
| Utility | 0.58 | 0.76 | 0.99 | - |
Values in this table indicate the proportion of participants simulated by the generating model who are best fit by the generating model in a pairwise comparison with each alternative model.
Statistical analyses
Statistical analyses were performed in R version 4.0.2 74R Development Core Team2016 with a two-tailed alpha threshold of p<0.05. For tests of trial-wise effects, we ran linear mixed-effects regression (lmer) or generalized linear mixed-effects regression (glmer) models (lme4 package; 5Bates et al.2015), which included participant as a random effect, and estimated random intercepts and slopes for each fixed effect. We used the ‘bobyqa’ optimizer with 1 million iterations. Trial number was included in lmer and glmer regression models. All independent variables were z-scored. We began with this maximal model, which converged for all analyses except one, for which we systematically reduced the complexity of the model until it converged 4Barr et al.201390Simonsohn2018, which algorithmically determines a break point in the distribution and tests whether regression lines on either side of the break point have significant slopes with opposite signs.
Reporting
For one-way and paired t-tests, we report t-statistics, p-values, and Cohen’s d with 95% confidence intervals (CIs; using the function cohensd in the rstatix package [one-way _t-test] or the effectsize package [paired t-test]).
For linear regressions, we report unstandardized regression coefficients, t-statistics, and p-values. We also report Cohen’s f2 with 95% CIs, a standardized effect size measure 22Cohen1992 computed by squaring the output of the function cohens_f in the effectsize package.
For multilevel models, we report test statistics (t for linear mixed-effects models and z for generalized linear mixed-effects models), p-values, and unstandardized effect sizes with 95% CIs (unstandardized coefficients for linear mixed-effects models, and odds ratios for generalized linear mixed-effects models).
Experiment 2
Next, we looked for evidence that valence biases in learning influence memory in a previously published independent dataset 82Rouhani et al.2018. Notably, results from this study suggested that unsigned PEs (i.e., PEs of greater magnitude whether negative or positive) facilitate subsequent memory, but no signed effect was observed. Here, we examined whether signed valence-specific effects might be evident when we account for individual differences in learning.
Briefly, adult participants completed a Pavlovian learning task (i.e., participants did not make choices and could not influence the observed outcomes) in which they encountered indoor and outdoor scenes. One type of scene had higher average value than the other. On each trial, an indoor or outdoor image was displayed, and participants provided an explicit prediction for the average value of that scene type. After the learning task, participants completed a memory test for the scenes. A detailed description of the experimental paradigm can be found in the original publication 82Rouhani et al.2018.
In order to derive each participant’s AI, we fit an ‘Explicit Prediction’ RL model to the participants’ estimation data (see Appendix 1 for more details on our model specification and fitting procedure). Similar to our RSTD model, this model included separate learning rates for trials with positive and negative PEs.
Importantly, the RSTD model and the Explicit Prediction model differed in that the RSTD model included a β parameter, while the Explicit Prediction model did not. In Experiment 1, this extra parameter allowed us to use the softmax function to convert the relative estimated values of the two machines into a probability of choosing each machine presented, which we then compared to participants’ actual choices during maximum likelihood estimation. In contrast, in Experiment 2, participants explicitly reported their value predictions (and did not make choices), so the model’s free parameters were fit by minimizing the difference between the model’s value estimates and participants’ explicit predictions.
References
-
- ABakkour
- DJPalombo
- AZylberberg
- YHKang
- AReid
- MVerfaellie
- MNShadlen
- DShohamy
-
- YBar-Haim
- DLamy
- LPergamin
- MJBakermans-Kranenburg
- MHIJzendoorn
-
- EEBarkley-Levenson
- LVan Leijenhorst
- AGalván
-
- DJBarr
- RLevy
- CScheepers
- HJTily
-
- DBates
- MMächler
- BBolker
- SWalker
-
- ABechara
- HDamasio
- DTranel
- ARDamasio
-
- DBernoulli
-
- NBiderman
- ABakkour
- DShohamy
-
- ARBlais
- EUWeber
-
- SJBlakemore
-
- AMBornstein
- MWKhaw
- DShohamy
- NDDaw
-
- BRBraams
- ACKDuijvenvoorde
- JSPeper
- EACrone
-
- MBBrodeur
- EDionne-Dostie
- TMontreuil
- MLepage
-
- MBBrodeur
- KGuérard
- MBouras
-
- BJCasey
- SGetz
- AGalvan
-
- RDCazé
- MAAMeer
-
- VChambon
- HThéro
- MVidal
- HVandendriessche
- PHaggard
- SPalminteri
-
- AChristakou
- SJGershman
- YNiv
- ASimmons
- MBrammer
- KRubia
-
- RHBChristensen
-
- MMChun
- NBTurk-Browne
-
- JCockburn
- AGECollins
- MJFrank
-
- JCohen
-
- JRCohen
- RFAsarnow
- FWSabb
- RMBilder
- SYBookheimer
- BJKnowlton
- RAPoldrack
-
- SMLCox
- MJFrank
- KLarcher
- LKFellows
- CAClark
- MLeyton
- ADagher
-
- WDabney
- ZKurth-Nelson
- NUchida
- CKStarkweather
- DHassabis
- RMunos
- MBotvinick
-
- JYDavidow
- KFoerde
- AGalván
- DShohamy
-
- NDDaw
- SKakade
- PDayan
-
- PDayan
- SKakade
- PRMontague
-
- JHDecker
- FSLourenco
- BBDoll
- CAHartley
-
- INDefoe
- JSDubas
- BFigner
- MAGAken
-
- DGDillon
- DAPizzagalli
-
- KDuncan
- ASemmler
- DShohamy
-
- JEDunsmoor
- VPMurty
- LDavachi
- EAPhelps
-
- KErgo
- EDe Loof
- TVerguts
-
- MJFrank
- LCSeeberger
- RCO’reilly
-
- MJFrank
- AAMoustafa
- HMHaughey
- TCurran
- KEHutchison
-
- MAGaddy
- REIngram
-
- AGalvan
- TAHare
- CEParra
- JPenn
- HVoss
- GGlover
- BJCasey
-
- AGalván
-
- AGalván
- KMMcGlennen
-
- SJGershman
-
- TUHauser
- RIannaccone
- SWalitza
- DBrandeis
- SBrem
-
- PCHolland
- FLSchiffino
-
- AIJang
- MRNassar
- DGDillon
- MJFrank
-
- RMJones
- LHSomerville
- JLi
- EJRuberry
- APowers
- NMehta
- JDyke
- BJCasey
-
- DKahneman
- ATversky
-
- FKalbe
- LSchwabe
-
- LKann
- TMcManus
- WAHarris
- SLShanklin
- KHFlint
- BQueen
- RLowry
- DChyen
- LWhittle
- JThornton
- CLim
- DBradford
- YYamakawa
- MLeon
- NBrener
- KAEthier
-
- PLKatzman
- CAHartley
-
- WKuyken
- RHowell
-
- FSLee
- HHeimer
- JNGiedd
- ESLein
- NŠestan
- DRWeinberger
- BJCasey
-
- GLefebvre
- MLebreton
- FMeyniel
- SBourgeois-Gironde
- SPalminteri
-
- MLengyel
- PDayan
-
- JELisman
- AAGrace
-
- EALudvig
- CRMadan
- NMcMillan
- YXu
- MLSpetch
-
- BLuna
-
- CRMadan
- EALudvig
- MLSpetch
-
- CRMadan
- EALudvig
- MLSpetch
-
- SLMaster
- MKEckstein
- NGotlieb
- RDahl
- LWilbrecht
- AGECollins
-
- JMichely
- EEldar
- AErdman
- IMMartin
- RJDolan
-
- OMihatsch
- RNeuneier
-
- KMogg
- BPBradley
-
- MMoutoussis
- ETBullmore
- IMGoodyer
- PFonagy
- PBJones
- RJDolan
- PDayan
- Neuroscience in Psychiatry Network Research Consortium
-
- VPMurty
- SDuBrow
- LDavachi
-
- VPMurty
- OFeldmanHall
- LEHunter
- EAPhelps
- LDavachi
-
- RNardou
- EMLewis
- RRothhaas
- RXu
- AYang
- EBoyden
- GDölen
-
- YNiv
- JAEdlund
- PDayan
- JPO’Doherty
-
- KNussenbaum
- CAHartley
-
- TPaus
- MKeshavan
- JNGiedd
-
- JMPearce
- GHall
-
- TCSPotter
- NVBryce
- CAHartley
-
- JWPratt
-
- EPulcu
- MBrowning
-
- R Development Core Team
-
- ARadulescu
- YNiv
- IBallard
-
- ARadulescu
- KHolmes
- YNiv
-
- AERaftery
-
- AMRodman
- KEPowers
- LHSomerville
-
- GMRosenbaum
- VVenkatraman
- LSteinberg
- JMChein
-
- GMRosenbaum
- CAHartley
-
- GMRosenbaum
- VVenkatraman
- LSteinberg
- JMChein
-
- NRouhani
- KANorman
- YNiv
-
- NRouhani
- YNiv
-
- SJSara
-
- CLSatterwhite
- ETorrone
- EMeites
- EFDunne
- RMahajan
- MCBOcfemia
- JSu
- FXu
- HWeinstock
-
- KWSchaie
-
- MNShadlen
- DShohamy
-
- TSharot
- NGarrett
-
- MHSilverman
- KJedd
- MLuciana
-
- USimonsohn
-
- LHSomerville
- SFSasse
- MCGarrad
- ATDrysdale
- NAbi Akar
- CInsel
- RCWilson
-
- LSteinberg
-
- LSteinberg
-
- RSSutton
- AGBarto
-
- ATversky
- DKahneman
-
- WBos
- MXCohen
- TKahnt
- EACrone
-
- WBos
- CARodriguez
- JBSchweitzer
- SMMcClure
-
- ACKDuijvenvoorde
- SPeters
- BRBraams
- EACrone
-
- ACKDuijvenvoorde
- NEBlankenstein
- EACrone
- BFigner
- METoplak
- JAWeller
-
- LVan Leijenhorst
- BGunther Moor
- ZAMacks
- SARBRombouts
- PMWestenberg
- EACrone
-
- DWechsler